Trading Royal Mail for profit
9th October 2014 15:43
by John Burford from interactive investor
Share on
This is the second of a series of four articles where I will explain how I use my tramline system to actively trade the markets for profit. Warning: I am not a buy-and-hold man (the FTSE is trading at the same level as in December 2007 - over six years ago!). Nor am I a "story" man, unless it is a minority opinion.
I developed my simple tramline system over several years to give me a set of rules which can provide me with trade entries at low risk. The low risk requirement was crucially important because no matter how firmly I believe in my trade, I could be wrong! And I wanted my wrong trades to hand me the smallest possible loss to my account. I figured the winners would take care of themselves.
The first part of each article will contain an extract from my book Tramline Trading which illustrates one of my five favourite trade setups that I detail in Chapter 4. The second part will illustrate the setup with a current example.
Charting With tramlines
In my first article last week, I explained how I use my tramline method to identify high probability/low risk trades. This is about the simplest method of analysis that can be imagined (I firmly believe in keeping things as simple as possible). If you can draw a straight line, you can master this method!
Last time, I found a trade in the Dow where I traded with the main trend in what was a tramline bounce. Today, I want to show you how I trade a tramline break, which occurs at a trend change. Too many investors and traders are unable to identify when the trend has changed and will stay with their position during a long and painful retrace. This method can help you avoid such experiences, and is valuable just for that reason alone.
Trading the tramline break
Tramlines do not work forever. At some point the market will break through one of them and when I see a tramline break I get excited by the potential whale trade that lies ahead. That is because a genuine break signals to me that the trend has very likely changed and I stand a good chance of being on board the new trend right from the very start, well before most traders have realised what has happened. Most of my best trades have started from a tramline break.
The other advantage is this: when I have a good position early in the new trend, I can afford to let minor set-backs run their course with little effect on my stress levels. If you jump on board a well-developed trend, there is every chance you will be caught up in a big counter-trend move, putting your position under water - and yourself under stress.
Obviously, there is a safe limit as to how early you can determine a trend change and take a position. Get in too early and you run the considerable risk that the trend really has not changed at all. Get in too late and you may be in at near the end.
That is why my tramline method is an excellent compromise and balances the risks well.
Let's look at the Nikkei chart:
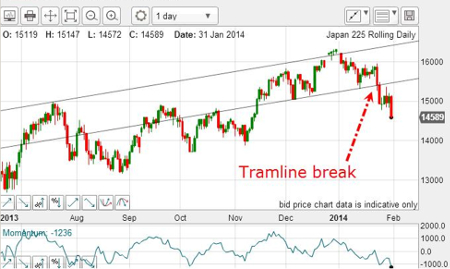
(click to enlarge)
This is the daily Nikkei and I have a good tramline pair working, especially in the most recent period, with good touch points on my lower tramline. On 23/24 January, the market broke below the lower tramline and the sell signal was generated on the tramline break, as well as the break of the most recent low touch point.
In addition, there was a negative momentum divergence at the recent high on the upper tramline, indicating likely buying exhaustion.
The break has signalled a change in trend and until otherwise disproved, trading from the short side is indicated.
Let's now look at the next chart, which shows the situation developing.
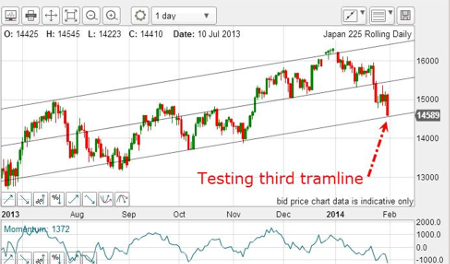
(click to enlarge)
If I draw in the third (lower) tramline, the market is currently testing this line of support and a short-term profit can be taken. Only a move above the centre tramline would indicate the new downtrend was not established yet. Provided the centre tramline operates as a solid line of resistance, the trend is now down.
The next chart shows a terrific example of a clean tramline break in USD/CAD.
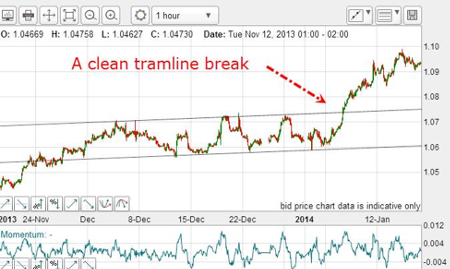
(click to enlarge)
The buy signal was given when the market moved up out of the trading channel and above the previous highs. Using the simple strategy of placing a buy-stop entry just above the upper tramline would have got you into a terrific trade.
How can I play a possible tramline break when I already have a position?
This is where a very useful strategy can be deployed.
.....to be continued.
A current example of a tramline break trade
Royal Mail
Remember the political furore surrounding the float last year? The accusation was that the government's advisors had deliberately ensured the issue price was set low (330p) so that the fund advisors could clean up in the inevitable IPO scramble.
In fact on issue day, 11 October, shares made an historic rise of 48% to the 455p level. Predictably, Vince Cable, the UK business secretary, was hauled over the coals in a ritual grilling by MPs who accused Cable of "robbing the UK taxpayer" of those gains.
Here we are, a year later, and with the benefit of hindsight, can we now answer that question?
In fact, the market edged higher into 2014 and made a textbook tramline pair and a lower tramline break in April. With the huge negative momentum divergence (red bar on momentum chart below), there was a classic sell signal in the 550 area.
Investors would be selling out at the 550 area and traders shorting there.
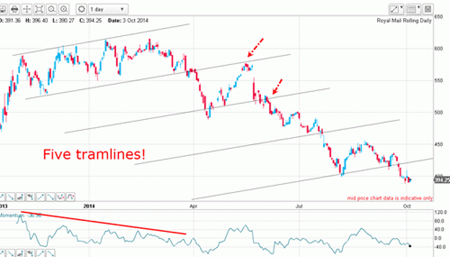
(click to enlarge)
But just admire the multiple tramlines I could then draw following the break. The red arrows show what I call the tramline kiss and scalded cat bounce. This is when the market breaks a tramline then reverses back to kiss it and then proceeds to move away smartly in what I call a scalded cat bounce (in honour of the term "dead cat bounce").
With the shares recently trading in the 390 area - a loss of around 30% from the 550 level - investors who were following the tramline breakdown have avoided that potential loss. They have funds ready to go in the next setup. Buy-and-hold investors will be sitting through this painful period. This little example is one more reason why I am not such an investor.
So what is the picture today?
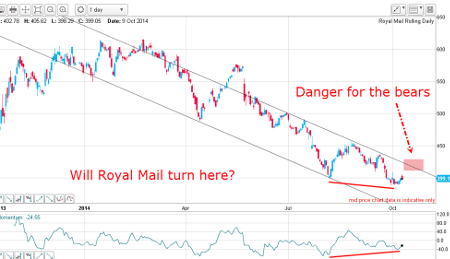
(click to enlarge)
The bears are certainly in control still, but a rally up to the upper tramline and into the pink zone could be the springboard for a stronger rally. But the bulls have one straw to grab - the potential positive momentum divergence which indicates a weakening of selling pressure. If this persists, the buying could raise the market like Lazarus.
But today, the trend remains firmly down and I am advising traders to hold shorts from 550 with a protect-profit stop just into the pink zone.
About the author
John C Burford is an ex-NASA scientist who defected to the financial world because it seemed to offer more mystery - and challenge. John is the well-known author of the MoneyWeek Trader emails where he illustrates aspects of his tramline system in real time markets.
 About the book
This book is an "in the trenches" practical guide on how to swing trade using John's tramline system with a heavy emphasis on money management. One of the unique features is John's trading diary of a four month period trading the swings in the Dow and gold.
An exciting new feature in financial publishing is the in-the-works Tramline Trading Alert service where you can receive timely email alerts to promising trading setups. Watch for details - out soon.
Special discount for Interactive Investor readers
RRP is £35 (paperback) and £25 (ebook) however it is available to Interactive Investor readers for the special price of £25 plus P&P for the paperback or £18 for the ebook.
- For the paperback offer enter IITTPB25 at the checkout.
- For the ebook offer enter IITTEB18 at the checkout.
Buy it here.
These articles are provided for information purposes only. Occasionally, an opinion about whether to buy or sell a specific investment may be provided by third parties. The content is not intended to be a personal recommendation to buy or sell any financial instrument or product, or to adopt any investment strategy as it is not provided based on an assessment of your investing knowledge and experience, your financial situation or your investment objectives. The value of your investments, and the income derived from them, may go down as well as up. You may not get back all the money that you invest. The investments referred to in this article may not be suitable for all investors, and if in doubt, an investor should seek advice from a qualified investment adviser.
Full performance can be found on the company or index summary page on the interactive investor website. Simply click on the company's or index name highlighted in the article.
Disclosure
We use a combination of fundamental and technical analysis in forming our view as to the valuation and prospects of an investment. Where relevant we have set out those particular matters we think are important in the above article, but further detail can be found here.
Please note that our article on this investment should not be considered to be a regular publication.
Details of all recommendations issued by ii during the previous 12-month period can be found here.
ii adheres to a strict code of conduct. Contributors may hold shares or have other interests in companies included in these portfolios, which could create a conflict of interests. Contributors intending to write about any financial instruments in which they have an interest are required to disclose such interest to ii and in the article itself. ii will at all times consider whether such interest impairs the objectivity of the recommendation.
In addition, individuals involved in the production of investment articles are subject to a personal account dealing restriction, which prevents them from placing a transaction in the specified instrument(s) for a period before and for five working days after such publication. This is to avoid personal interests conflicting with the interests of the recipients of those investment articles.