The best Head and Shoulders signal ever
17th October 2014 14:11
by John Burford from interactive investor
Share on
This is the third in a series of four articles where I will explain how I use my tramline system to actively trade the markets for profit. Warning: I am not a buy-and-hold man (the FTSE is trading at the same level as in December 2007 - over six years ago!). Nor am I a "story" man, unless it is a minority opinion.
I developed my simple tramline system over several years to give me a set of rules which can provide me with trade entries at low risk. The low risk requirement was crucially important because no matter how firmly I believe in my trade, I could be wrong! And I wanted my wrong trades to hand me the smallest possible loss to my account. I figured the winners would take care of themselves.
The first part of each article will contain an extract from my book Tramline Trading which illustrates one of my five favourite trade setups that I detail in Chapter 4. The second part will illustrate the setup with a current example.
The Head and Shoulders (H&S)
This is a classic reversal pattern that is sometimes seen at the end of a long trend, though not all trends terminate in an H&S. Many technicians erroneously assign this pattern in the middle of a swing move, or not at the end of a major run. In my experience, the true Head & Shoulders occurs infrequently. I look for it especially on the daily and hourly charts and it can be seen in both after a long rally or a long decline.
A good example is shown in the hourly chart of the T-Bonds.
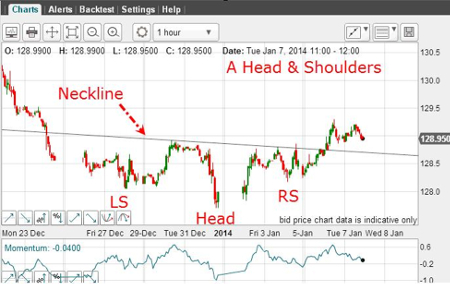
(click to enlarge)
After a solid down-trending phase, the market made a low in the Left Shoulder (LS), then rallied but couldn't hold it and dropped to a new low to the Head, rallied again but couldn't hold that and then declined - but not to a new low - in the Right Shoulder (RS). From there, it rallied and broke through the Neckline (the line joining the minor highs between the Head and the two Shoulders).
How do I trade the H&S?
The Neckline break has confirmed the reversal pattern and now the market will likely come back down to test the Neckline in a kiss. There are two candidates for a long trade entry: at the Neckline break and at the testing of the Neckline at the kiss. Placing a buy-stop entry just above the Neckline is my preferred trade entry method. Provided the market breaks above the Neckline, that guarantees a position. The market often moves very sharply from these patterns and you will have a good entry using this method.
The other technique is to wait for the market to test the Neckline after the break has occurred. What I am looking for is a kiss on the line and a Scalded Cat Bounce (see Section 3.6) up and away. The problem here is this: the kiss may not happen! The market could simply take off on the upside without you. But if you miss it, you miss it - move on. You may get another low-risk opportunity later. At least you have identified an H&S reversal and the trend should now be firmly established and you can use your usual methods from there.
If we took the long trade on the Neckline break, we could place our protective stop just below the RS. This is a very sensible place, since a break of this level would very likely cancel out the H&S pattern and the market would likely continue lower, where we would not want to be long.
How did this trade develop?
This shows the chart a few days later, where we can see the move up and away from the H&S pattern.
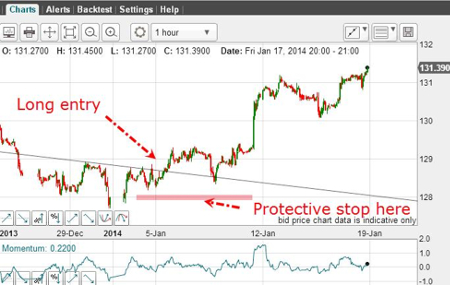
(click to enlarge)
The market did retreat to test the Neckline in a kiss (with a slight overshoot), but staged a vigorous rally in a Scalded Cat Bounce. That was a nice confirmation of the H&S bottom.
Here is another example in the hourly chart of Hong Kong Stock Index.
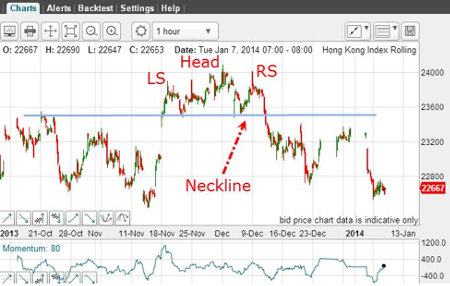
(click to enlarge)
The market had been in a strong rally phase and in mid-November had made a new high for the move. It then traced out a lovely complex Head & Shoulders with the horizontal neckline also lying on chart support from the previous minor high of 21 October. But in early December, the market made a bold break of the Neckline, thus confirming the H&S pattern. The Neckline then became a line of resistance. Note that the rallies back to the line failed to kiss it, which indicated an underlying weakness.
A current example of a H&S reversal in the Nikkei
Many have been bullish on Japan recently in the wake of Abenomics and its apparent success in driving the yen lower to stimulate their economy - and boost exports.
But I sensed that the recent rally was a bull trap and was waiting for a solid signal to trade short.
In fact, I had been anticipating a top in stockmarkets all summer and pencilled in the months of September for the top and October for the crash. After all, these were the traditional months for such events to occur. And today, I can say that this picture is being played out to the letter.
In late September, I spotted this head and shoulders pattern in the Nikkei at the highs:
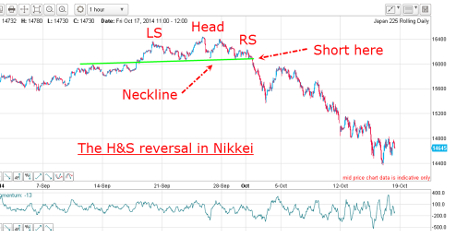
(click to enlarge)
The neckline break was the prime signal to exit longs and position short in Japanese shares.
The market has declined by over 1,000 points this month from that point and has made it one of the best H&S signals I have seen.
Naturally, I am looking for much lower levels, but with sharp intervening rallies.
About the author
John C Burford is an ex-NASA scientist who defected to the financial world because it seemed to offer more mystery - and challenge. John is the well-known author of the MoneyWeek Trader emails where he illustrates aspects of his tramline system in real time markets.
 About the book
This book is an "in the trenches" practical guide on how to swing trade using John's tramline system with a heavy emphasis on money management. One of the unique features is John's trading diary of a four month period trading the swings in the Dow and gold.
An exciting new feature in financial publishing is the in-the-works Tramline Trading Alert service where you can receive timely email alerts to promising trading setups. Watch for details - out soon.
Special discount for Interactive Investor readers
RRP is £35 (paperback) and £25 (ebook) however it is available to Interactive Investor readers for the special price of £25 plus P&P for the paperback or £18 for the ebook.
- For the paperback offer enter IITTPB25 at the checkout.
- For the ebook offer enter IITTEB18 at the checkout.
Buy it here.
This article is for information and discussion purposes only and does not form a recommendation to invest or otherwise. The value of an investment may fall. The investments referred to in this article may not be suitable for all investors, and if in doubt, an investor should seek advice from a qualified investment adviser.
These articles are provided for information purposes only. Occasionally, an opinion about whether to buy or sell a specific investment may be provided by third parties. The content is not intended to be a personal recommendation to buy or sell any financial instrument or product, or to adopt any investment strategy as it is not provided based on an assessment of your investing knowledge and experience, your financial situation or your investment objectives. The value of your investments, and the income derived from them, may go down as well as up. You may not get back all the money that you invest. The investments referred to in this article may not be suitable for all investors, and if in doubt, an investor should seek advice from a qualified investment adviser.
Full performance can be found on the company or index summary page on the interactive investor website. Simply click on the company's or index name highlighted in the article.
Disclosure
We use a combination of fundamental and technical analysis in forming our view as to the valuation and prospects of an investment. Where relevant we have set out those particular matters we think are important in the above article, but further detail can be found here.
Please note that our article on this investment should not be considered to be a regular publication.
Details of all recommendations issued by ii during the previous 12-month period can be found here.
ii adheres to a strict code of conduct. Contributors may hold shares or have other interests in companies included in these portfolios, which could create a conflict of interests. Contributors intending to write about any financial instruments in which they have an interest are required to disclose such interest to ii and in the article itself. ii will at all times consider whether such interest impairs the objectivity of the recommendation.
In addition, individuals involved in the production of investment articles are subject to a personal account dealing restriction, which prevents them from placing a transaction in the specified instrument(s) for a period before and for five working days after such publication. This is to avoid personal interests conflicting with the interests of the recipients of those investment articles.