Chart of the week: This miner is gold dust
8th December 2014 11:22
by John Burford from interactive investor
Share on
By John C Burford, author of Tramline Trading, and editor of MoneyWeek Trader
In these weekly articles, I will highlight a share that I believe has an interesting chart pattern. I am primarily a technical trader and use the methods I have developed that I call Tramline Trading. You can read more about my methods in my book Tramline Trading, which you can inspect here.
Most traders and investors make classic errors by chasing a stock near a top and then hang on to it too long during the decline. You will vastly improve your performance by timing your entries and exits more expertly - and that is what I hope to help you with.
My goal in these articles is to cover a share that has an interesting chart. I developed my tramline system over several years to give me a set of rules which can provide me with trade entries at low risk. The low risk requirement was crucially important because no matter how firmly I believe in my trade, I could be wrong! And I wanted my wrong trades to hand me the smallest possible loss to my account. I figured the winners would take care of themselves.
My hope is that you glean useful ideas and employ at least some technical analysis to bolster your returns. In trading as well as investing, timing is a key factor in your eventual returns.
Fresnillo - is it about to become a Mexican jumping bean?
is the world's largest producer of silver and Mexico's second largest gold producer. The company has been in Mexico since 1887 and controls the largest acreage of precious metals land reserve in that country.
The shares are listed in London and are one of the FTSE 100 components.
As a major precious metals (PM) producer, Fresnillo's share price has been slaughtered in recent months as PM prices have fallen off a cliff. But with the metals showing recent signs of a turnaround, are Fresnillo shares worth taking another look at?
If PM prices can push up well into 2015, the outlook for mining companies such as Fresnillo will look a lot brighter than they do at present.
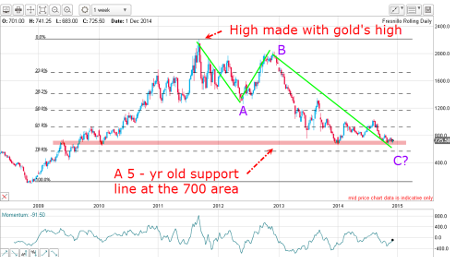
Here is the weekly chart since 2008:
(click to enlarge)
There are several interesting points in this chart:
1. The share price rose to its top with PMs into the gold high in 2011.
2. Share price has declined by 68% while gold has declined by 40% off the 2011 tops. The gearing of share price to gold price is about 1.5 to 1
3. Market is approaching a five-year support zone
4. The decline off the 2011 top has an A-B-C form.
To me, point number 4 is compelling evidence that when the low is in, the market will recover rapidly. This is because according to Elliott wave theory, a three-wave A-B-C is a counter-trend move to the one larger trend.
If you take the 2008 low as the starting point, the rally to the 2011 high is the main trend (up) and the A-B-C is a corrective wave. When the C wave ends (see text, pp 89 - 90, 97 - 104), the main trend will resume.
And the support zone would be a terrific place for the C wave to end! With today's share price at the 720p level, the market is essentially at the top end of this zone.
Where is gold/silver heading?
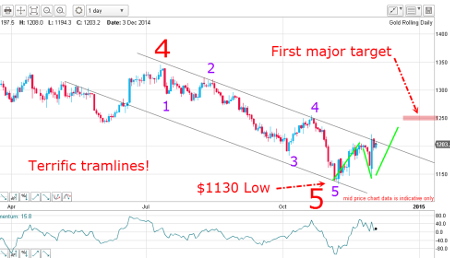
The Fresnillo share price moves more or less arm-in-arm with PM prices (with a 1.5 to1 gearing), so let's have a look at the gold chart and try to discern where gold is heading into 2015. That will have a major bearing on Fresnillo into next year:
(click to enlarge)
This is the daily chart over the past nine months. I have a large wave 5 down and that wave contains a clear motive five-wave pattern (purple labels). The low is $1130 and since then, the market has rallied sharply up from my lower tramline up to the upper tramline.
According to my tramline trading rule (see text, pp49, 66 - 68), a significant break up past that tramline is a signal that the trend has changed. So far, I have an up/down and currently, we are in a third wave up.
If this is the correct EW interpretation, the upper tramline will be broken soon. That would place the $1250 level as my first major target.
PMs are early in a rally phase
Because the market has completed fifth waves of several degrees of trend, the implication is clear: expect a multi-month rally phase at least.
And this forecast becomes even more compelling when the sentiment picture is considered. Markets make their highs when bullish sentiment is maxed out. They also make their lows when bearish sentiment has maxed out. That is a golden rule of the markets.
In recent weeks, bearish sentiment towards PMs has been scraping along the bottom. Gold, in particular, has had a barrage of negative press with widespread forecasts for sub-$1,000.
The AAII survey of professional advisors recently had gold bulls at around 4%, which is abnormally low in historical terms. Normally, even in a down market, gold retains a sizeable core of die-hard gold bugs. But this year, with equities in massive bull markets, investors see no reason to hold gold (it pays no dividends).
In fact, one prominent pundit stated: "Perhaps that's the best thing you can say about gold," says a senior commodity consultant. "Everyone is bearish on it. Honestly, though, I cannot see any bullish story at all".
That is precisely the kind of capitulation talk I love to read! Then, I know a major turn is nigh. You can take this to the bank: markets make bottoms when no-one can see any bullish story at all. As the market rallies, more and more begin to see what they failed to spot earlier - a bullish story. That is what makes markets move.
Outlook
With PMs due for a multi-month rally phase, Fresnillo shares will rally in tandem. The absolute lows may not be in yet, but they appear very close.
These articles are provided for information purposes only. Occasionally, an opinion about whether to buy or sell a specific investment may be provided by third parties. The content is not intended to be a personal recommendation to buy or sell any financial instrument or product, or to adopt any investment strategy as it is not provided based on an assessment of your investing knowledge and experience, your financial situation or your investment objectives. The value of your investments, and the income derived from them, may go down as well as up. You may not get back all the money that you invest. The investments referred to in this article may not be suitable for all investors, and if in doubt, an investor should seek advice from a qualified investment adviser.
Full performance can be found on the company or index summary page on the interactive investor website. Simply click on the company's or index name highlighted in the article.
Disclosure
We use a combination of fundamental and technical analysis in forming our view as to the valuation and prospects of an investment. Where relevant we have set out those particular matters we think are important in the above article, but further detail can be found here.
Please note that our article on this investment should not be considered to be a regular publication.
Details of all recommendations issued by ii during the previous 12-month period can be found here.
ii adheres to a strict code of conduct. Contributors may hold shares or have other interests in companies included in these portfolios, which could create a conflict of interests. Contributors intending to write about any financial instruments in which they have an interest are required to disclose such interest to ii and in the article itself. ii will at all times consider whether such interest impairs the objectivity of the recommendation.
In addition, individuals involved in the production of investment articles are subject to a personal account dealing restriction, which prevents them from placing a transaction in the specified instrument(s) for a period before and for five working days after such publication. This is to avoid personal interests conflicting with the interests of the recipients of those investment articles.