Chart of the week: What's the trend for M&S shares?
5th January 2015 10:36
by John Burford from interactive investor
Share on
By John C Burford, author of Tramline Trading, and editor of MoneyWeek Trader
In these weekly articles, I will highlight a share that I believe has an interesting chart pattern. I am primarily a technical trader and use the methods I have developed that I call Tramline Trading. You can read more about my methods in my book Tramline Trading, which you can inspect here.
Most traders and investors make classic errors by chasing a stock near a top and then hang on to it too long during the decline. You will vastly improve your performance by timing your entries and exits more expertly - and that is what I hope to help you with.
My goal in these articles is to cover a share that has an interesting chart. I I developed my tramline system over several years to give me a set of rules which can provide me with trade entries at low risk. The low risk requirement was crucially important because no matter how firmly I believe in my trade, I could be wrong! And I wanted my wrong trades to hand me the smallest possible loss to my account. I figured the winners would take care of themselves.
My hope is that you glean useful ideas and employ at least some technical analysis to bolster your returns. In trading as well as investing, timing is a key factor in your eventual returns.
Will the Christmas trading report confirm M&S rally?
is an iconic brand that is one of the bedrocks of British retailing. The shares have been a classic "widows and orphans" holding for many years with decent dividend payouts. It is a well-loved institution, but recently its offerings in the clothing departments have been shunned in favour of more "trendy" designs from other retailers.
I do not pretend to be an expert in women's fashions (although I did once help my wife to market a few couture designs a few decades ago). I did realise early on that customers are fickle creatures and today, women of all ages are determined to appear younger. And the relatively frumpy and staid M&S offerings just don't appeal any more to a vanishing breed of women.
But the job of management is to recognise new trends and to adapt - just as they must and do in technology companies (see my recent post on ). But M&S is like a large oil tanker (global sales over £10 billion with profits before tax of £600 million) - and these behemoths take time to turn around, even if they have the right people to do it, and that is not a given.
Radical thinking is not usually welcomed in big companies.
This is a common problem in large "institutions": they eventually become too big to change, unless forced to do so. In the public sector, there is no commercial imperative to change (please don't get me started on this theme!). But in the harshly competitive and non-governmental world of UK retailing, when you are at the top everyone is trying to take you down - and there are few barriers to entry.
But the job of an investor/trader of the stock is to anticipate any adverse or beneficial future developments. And that is where a study of the charts can be immensely helpful.
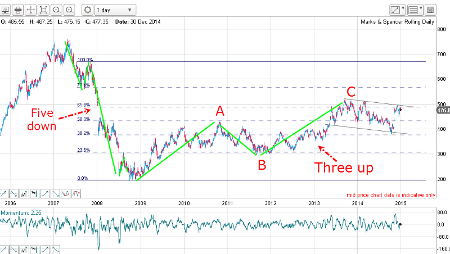
This is the daily chart showing the 2007 high at 750p:
(click to enlarge)
The low of 200 was accomplished in five clear motive waves with a very long and strong wave 3 (see text, pp 87-89). The recovery off this low has been a long drawn-out affair, but the shape is in a clear three A-B-C form (see text, pp 89-90, 97-104). This three-wave form is entirely typical of a corrective pattern (corrective to the initial five down).
The C wave high has just exceeded the Fibonacci 62% retracement of the third wave down, and that is a typical limit to a recovery. This high occurred in September 2013 at the 520 level and since then, the market has traded in a wide band with the most recent low in October last year.
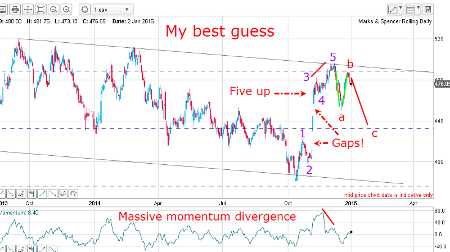
Let's take a look a close-up on the hourly chart:
(click to enlarge)
I have drawn in my tramlines (see text, pp 22-26, 48-52) and from the October low at 380, the market rallied strongly in a textbook five up with the third wave particularly strong with those two stand-out gaps.
The fifth wave sports a very large momentum divergence, indicating a weakening of buying pressure into the fifth wave high.
Also, gaps have a habit of being filled reasonably promptly, so this indicates downward pressure in the short-term.
Outlook
After wave 5 hit my upper tramline (resistance) in December, it has moved down in an "a" wave, up in a "b" wave and now is on the verge of moving down in a "c" wave.
The textbook trade was a short sale at the "b" wave high with a protective stop just above the upper tramline.
The big October-December rally smacks of a short squeeze, so the odds favour a resumption of the downtrend in January.
A solid move above my upper tramline would change the near-term picture somewhat, but the general trend (see first chart) remains down.
These articles are provided for information purposes only. Occasionally, an opinion about whether to buy or sell a specific investment may be provided by third parties. The content is not intended to be a personal recommendation to buy or sell any financial instrument or product, or to adopt any investment strategy as it is not provided based on an assessment of your investing knowledge and experience, your financial situation or your investment objectives. The value of your investments, and the income derived from them, may go down as well as up. You may not get back all the money that you invest. The investments referred to in this article may not be suitable for all investors, and if in doubt, an investor should seek advice from a qualified investment adviser.
Full performance can be found on the company or index summary page on the interactive investor website. Simply click on the company's or index name highlighted in the article.
Disclosure
We use a combination of fundamental and technical analysis in forming our view as to the valuation and prospects of an investment. Where relevant we have set out those particular matters we think are important in the above article, but further detail can be found here.
Please note that our article on this investment should not be considered to be a regular publication.
Details of all recommendations issued by ii during the previous 12-month period can be found here.
ii adheres to a strict code of conduct. Contributors may hold shares or have other interests in companies included in these portfolios, which could create a conflict of interests. Contributors intending to write about any financial instruments in which they have an interest are required to disclose such interest to ii and in the article itself. ii will at all times consider whether such interest impairs the objectivity of the recommendation.
In addition, individuals involved in the production of investment articles are subject to a personal account dealing restriction, which prevents them from placing a transaction in the specified instrument(s) for a period before and for five working days after such publication. This is to avoid personal interests conflicting with the interests of the recipients of those investment articles.