Chart of the week: Perfect picture
2nd February 2015 09:58
by John Burford from interactive investor
Share on
By John C Burford, author of Tramline Trading, and editor of MoneyWeek Trader
In these weekly articles, I will highlight a share that I believe has an interesting chart pattern. I am primarily a technical trader and use the methods I have developed that I call Tramline Trading. You can read more about my methods in my book Tramline Trading, which you can inspect here.
Most traders and investors make classic errors by chasing a stock near a top and then hang on to it too long during the decline. You will vastly improve your performance by timing your entries and exits more expertly - and that is what I hope to help you with.
My goal in these articles is to cover a share that has an interesting chart. I I developed my tramline system over several years to give me a set of rules which can provide me with trade entries at low risk. The low risk requirement was crucially important because no matter how firmly I believe in my trade, I could be wrong! And I wanted my wrong trades to hand me the smallest possible loss to my account. I figured the winners would take care of themselves.
My hope is that you glean useful ideas and employ at least some technical analysis to bolster your returns. In trading as well as investing, timing is a key factor in your eventual returns.
Pearson is testing old highs - will it flunk it?
is a major global player in the educational field which includes the hot sector of online courses and testing. The English language is in the process of conquering the world as the lingua franca and this has opened up a huge potential audience for the company’s language products.
Investing in the almost unlimited global market for English tuition must be a no-brainer, surely? If it were only that simple!
A major deal was struck recently with whereby Pearson would be the sole global exam provider. The Pearson VUE system is the global leader in computer-based testing for IT, academic, government and professional organisations around the world.
So what could possibly go wrong for the company's shares? They yield a reasonable 2.7% in dividends.
Let's examine the charts for clues.
This is the daily chart going back to 2013 and it shows the market has rallied in January to the £13.80 area, which was the previous high back in 2013.
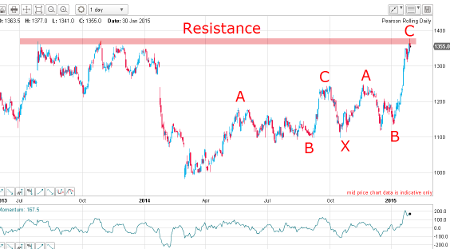
To a technical trader, matching a major high that was put in years before is a significant event. It is uncanny how these levels, often made years before, frequently represents very strong resistance to further advances. It is as if the market has a memory - and it does!
How is it that the lows (and highs) made even years apart can lie on a straight line? Or markets often reverse right on a Fibonacci retrace?
After spending years in the markets, I still cannot fathom out why this happens, but it does - and I can use this knowledge to my advantage.
Gazing at the above chart, I can place Elliott wave labels on the waves up from the March 2014 lows. They are a series of A-B-Cs which deeply overlap each other. That is a sign of a corrective move, indicating the main trend remains down. That is the first clue.
And the latest rally phase starting in December is a very steep C wave. The C wave is the final wave of an A-B-C before the main trend resumes.
So let's zoom in on this wave to find more clues:
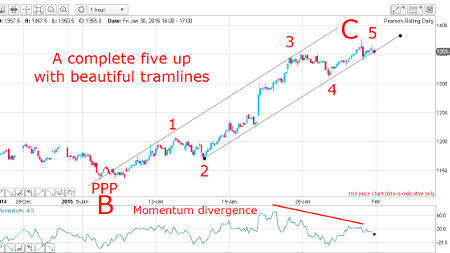
And what a beautiful five wave motive pattern on this rally - it is pure textbook. Not only do I have a clean five up, but the waves can be contained within my wonderful tramlines, which obey all of the rules and guidelines of tramline construction (see text, pp 22-26, 48-52).
The lower tramline connects the lows of waves 2 and 4, as required. Then, my upper tramline sports a solid Prior Pivot Point (PPP, see text, pp 52-53) and connects waves 1 and 3. And within the third wave, momentum reaches a maximum, indicating it was a long and strong wave, as required.
And if you look carefully, you will spot five mini-waves within the third wave - added confirmation of my EW count.
Finally, the wave 5 high of last Friday was made with a huge momentum divergence between the wave 3 momentum maximum. This divergence in the momentum readings indicates that the buying power in wave 5 is weaker than that in wave 3 - the market is losing momentum. In fact, this divergence is entirely typical behaviour of fifth waves - and helps me identify it as such.
Fifth waves are almost always weaker than third waves
According to Elliott wave theory, fifth waves in a motive pattern are almost always weaker than the third waves and this can be measured in any number of ways with the momentum oscillator being the simplest measure. I like to keep things simple!
This picture is about as perfect as you will ever see with the Elliott wave five up motive pattern contained within textbook tramlines. The above chart must go into my next textbook!
OK, we could have a completed five up in a final C wave and within that C wave, we could have a complete five up. Remember, fifth waves are ending waves.
The implication is clear - the trend should start reversing very soon - provided we see a downturn from near current levels.
Outlook
The Elliott wave pattern and last week's rally to multi-year resistance tells me that odds favour an immediate reversal is very likely at hand. Now if this does occur, tracking the shape of the waves off the top will provide me with clues as to the likely downside targets.
In particular, I will want to see a sharp break of the lower tramline early next week and either a clear five down or an A-B-C down. An A-B-C will indicate new highs are possible, but a small-scale five down will provide confirmation the trend is down with first target in the £12.50 region.
But if the lower tramline can hold, the market may make a new high in a new fifth wave.
For a trader, the key entry point is on a clean break of the lower tramline, whenever that occurs.
These articles are provided for information purposes only. Occasionally, an opinion about whether to buy or sell a specific investment may be provided by third parties. The content is not intended to be a personal recommendation to buy or sell any financial instrument or product, or to adopt any investment strategy as it is not provided based on an assessment of your investing knowledge and experience, your financial situation or your investment objectives. The value of your investments, and the income derived from them, may go down as well as up. You may not get back all the money that you invest. The investments referred to in this article may not be suitable for all investors, and if in doubt, an investor should seek advice from a qualified investment adviser.
Full performance can be found on the company or index summary page on the interactive investor website. Simply click on the company's or index name highlighted in the article.
Disclosure
We use a combination of fundamental and technical analysis in forming our view as to the valuation and prospects of an investment. Where relevant we have set out those particular matters we think are important in the above article, but further detail can be found here.
Please note that our article on this investment should not be considered to be a regular publication.
Details of all recommendations issued by ii during the previous 12-month period can be found here.
ii adheres to a strict code of conduct. Contributors may hold shares or have other interests in companies included in these portfolios, which could create a conflict of interests. Contributors intending to write about any financial instruments in which they have an interest are required to disclose such interest to ii and in the article itself. ii will at all times consider whether such interest impairs the objectivity of the recommendation.
In addition, individuals involved in the production of investment articles are subject to a personal account dealing restriction, which prevents them from placing a transaction in the specified instrument(s) for a period before and for five working days after such publication. This is to avoid personal interests conflicting with the interests of the recipients of those investment articles.