Chart of the week: Where next for Tesco, BT and Royal Mail?
9th February 2015 11:50
By John C Burford, author of Tramline Trading, and Editor of MoneyWeek Trader
In these weekly articles, I will highlight a share that I believe has an interesting chart pattern. I am primarily a technical trader and use the methods I have developed that I call Tramline Trading. You can read more about my methods in my book Tramline Trading, which you can inspect here.
Most traders and investors make classic errors by chasing a stock near a top and then hang on to it too long during the decline. You will vastly improve your performance by timing your entries and exits more expertly - and that is what I hope to help you with.
My goal in these articles is to cover a share that has an interesting chart. I I developed my tramline system over several years to give me a set of rules which can provide me with trade entries at low risk. The low risk requirement was crucially important because no matter how firmly I believe in my trade, I could be wrong! And I wanted my wrong trades to hand me the smallest possible loss to my account. I figured the winners would take care of themselves.
My hope is that you glean useful ideas and employ at least some technical analysis to bolster your returns. In trading as well as investing, timing is a key factor in your eventual returns.
I thought it would be useful to review three of my featured Charts of the Week from last year to monitor their progress and to reinforce the lessons they teach that you can use my simple methods to improve the timing of your entries and exits.
Upate on BT (22 December)
On that date, I analysed the charts of and found some stunning patterns that gave me high-probability forecasts for the direction of the shares - up.
In fact, these patterns were some of the best - and most reliable - of all of the FTSE shares that I discovered at the time.
This is the updated long range chart showing the beautiful tramlines:
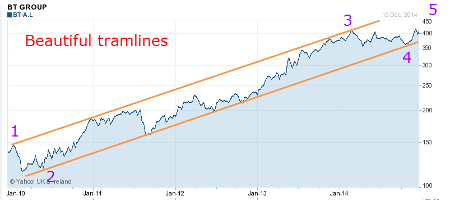
Since 22 December when BT was trading at the 400p area, the market has continued moving up towards my upper tramline and has reached the 450 area. The bounce off the lower tramline has continued, as expected.
But it is the shorter-term pattern I showed last time that is at least as impressive. Here is the chart last time:
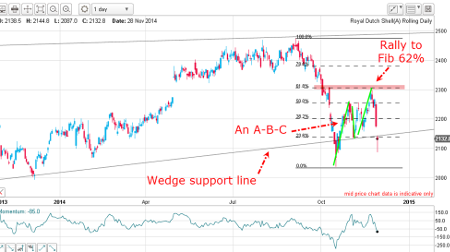
On this daily chart, I have Elliott waves 3 and 4 shown - with wave 5 already under way. The solid wedge pattern (see text, pp 33-38, 71 - 80, 152) heralds a likely continuation of wave 5 into higher ground. Note that the market had pulled back to my upper wedge line for a traditional kiss (see text, pp 83-84, 143).
That was a textbook long entry point.
So, has the market continued its wave 5 development? Here is the latest chart:
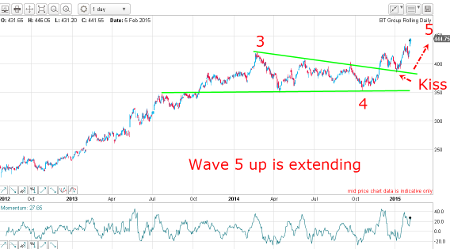
Right on cue after the kiss, the market has rallied in a sharp scalded cat bounce, thus validating the kiss as the precursor to an expected rally phase.
My main near-term target is the upper tramline in the 500 area.
Incidentally, I did not need any news, such as BT's acquisition of the mobile network EE to arrive at my conclusions. I am tempted to say that the chart would look the same without it!
The lesson here? When you see a wedge pattern like this, take full advantage! I find the wedge is a very reliable signaling pattern.
Update on Royal Mail (9 October)
In my article of 9 October, I had this chart of , which was in a hard downtrend:
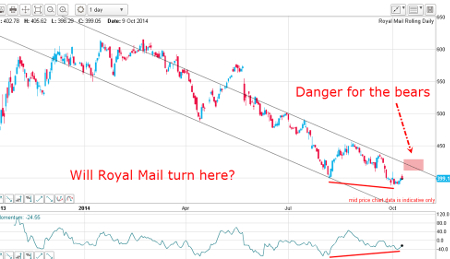
I had a good tramline pair working and noted that if the market could rally above the upper tramline and into the pink zone, that would be a great place to either cover shorts and/or go long, especially with the momentum divergence (red bar).
So, did the market oblige and turn there? Here is latest chart:
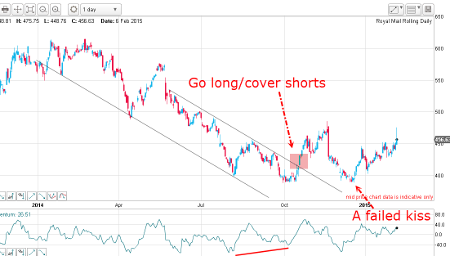
And how! The recovery blasted up past the pink zone, where resting buy orders were amassed from the shorts and the new longs.
But after exhausting the buying, the market attempted to get back to the upper tramline to plant the traditional kiss (see the BT example above).
But the attempt failed, leaving a huge gap. That was highly significant because it indicated the selling pressure was so strong that the selling couldn't even manage a kiss. Evidently, the buying pressure would emerge victorious to force the market back up, and so it has proved.
The next target is the November high at 470. Moving past that would set the next target at 500, which is the Fibonacci 50% retrace of the big wave down off the February high.
But a failure here would bring about a set-back to perhaps the 400 area again. But the two lows in the 390 area could be a genuine double bottom, which is another reliable reversal pattern.
Curiously, both BT and Royal Mail have identical near-term targets at 500! How appropriate for the twin monopoly titans of the pre-privatised British communications industry which were of course joined at one time as the Post Office.
Update on Tesco (17 November)
In my 17 November article, I posted this chart:
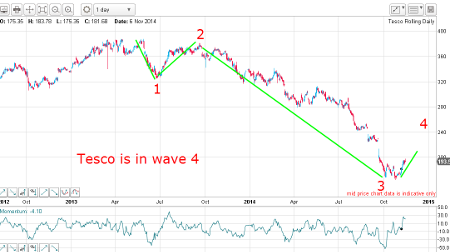
was plunging amid accounting scandals, poor sales and bullying of its suppliers. It really looked dire. But I suggested that the low was in and the market would rally in a wave 4 to top out in December/January.
And has it? Here is the updated chart:
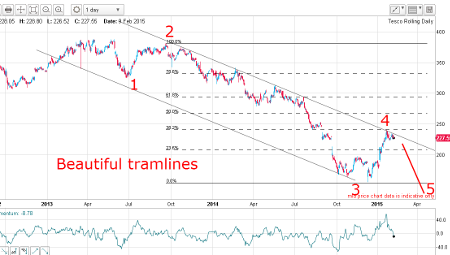
Yes, indeed. Wave 4 has carried to the conjunction of the Fibonacci 38% level and my upper tramline. This is a very powerful area of resistance.
So, a long trade in November to ride wave 4 up at the 180 area and cashing out near current levels in the 230 area has resulted in a 50p gain, or almost 30% in less than three months.
My forecast for the wave 4 high in December/January is also on track, since the high to date is 241 made on 23 January.
Outlook
Tesco has a huge mountain to climb from here with the huge chart resistance at the 240 area. Odds are increasing that the market will start its wave 5 down soon.
This article is for information and discussion purposes only and does not form a recommendation to invest or otherwise. The value of an investment may fall. The investments referred to in this article may not be suitable for all investors, and if in doubt, an investor should seek advice from a qualified investment adviser.
These articles are provided for information purposes only. Occasionally, an opinion about whether to buy or sell a specific investment may be provided by third parties. The content is not intended to be a personal recommendation to buy or sell any financial instrument or product, or to adopt any investment strategy as it is not provided based on an assessment of your investing knowledge and experience, your financial situation or your investment objectives. The value of your investments, and the income derived from them, may go down as well as up. You may not get back all the money that you invest. The investments referred to in this article may not be suitable for all investors, and if in doubt, an investor should seek advice from a qualified investment adviser.
Full performance can be found on the company or index summary page on the interactive investor website. Simply click on the company's or index name highlighted in the article.
Disclosure
We use a combination of fundamental and technical analysis in forming our view as to the valuation and prospects of an investment. Where relevant we have set out those particular matters we think are important in the above article, but further detail can be found here.
Please note that our article on this investment should not be considered to be a regular publication.
Details of all recommendations issued by ii during the previous 12-month period can be found here.
ii adheres to a strict code of conduct. Contributors may hold shares or have other interests in companies included in these portfolios, which could create a conflict of interests. Contributors intending to write about any financial instruments in which they have an interest are required to disclose such interest to ii and in the article itself. ii will at all times consider whether such interest impairs the objectivity of the recommendation.
In addition, individuals involved in the production of investment articles are subject to a personal account dealing restriction, which prevents them from placing a transaction in the specified instrument(s) for a period before and for five working days after such publication. This is to avoid personal interests conflicting with the interests of the recipients of those investment articles.
Editor's Picks