Chart of the week: Another stunning opportunity
23rd February 2015 12:00
by John Burford from interactive investor
Share on
By John C Burford, author of Tramline Trading, and Editor of MoneyWeek Trader
In these weekly articles, I will highlight a share that I believe has an interesting chart pattern. I am primarily a technical trader and use the methods I have developed that I call Tramline Trading. You can read more about my methods in my book Tramline Trading, which you can inspect here.
Most traders and investors make classic errors by chasing a stock near a top and then hang on to it too long during the decline. You will vastly improve your performance by timing your entries and exits more expertly - and that is what I hope to help you with.
My goal in these articles is to cover a share that has an interesting chart. I I developed my tramline system over several years to give me a set of rules which can provide me with trade entries at low risk. The low risk requirement was crucially important because no matter how firmly I believe in my trade, I could be wrong! And I wanted my wrong trades to hand me the smallest possible loss to my account. I figured the winners would take care of themselves.
My hope is that you glean useful ideas and employ at least some technical analysis to bolster your returns. In trading as well as investing, timing is a key factor in your eventual returns.
BP at critical juncture
As you know, my fundamental belief about the markets is this: markets drive the news. Most investors put the cart before the horse and work from the polar opposite stance. They scour the news feed in an attempt to divine the likely market reaction and confirm their bias.
But most of the time, this is a fruitless task because markets often move opposite to the "obvious" way. Trading off the news very often leads to nasty whipsaw trades.
And when stocks are riding high, bullish news predominates - and vice versa. But when stocks slide, bearish news follows. In fact, the news appears the most bullish at tops.
When all is said and done, what drives an investor to buy or sell a stock? What motivates them to act (not to just sit and watch)? Is it a close study of the fundamentals - the weighing up of the pros and cons and reading the latest news?
When reduced to its basics, it is the investor's feeling about their analysis that motivates the act of buying or selling. There is no universal human law that makes an investor buy or sell a share when the numbers (for profit, earnings, sales, debt, assets, and the other factors) point to one of the two options.
No bell is rung when the investor adds up those pros and cons shouting: "Buy" or "Sell". No, if the investor is already feeling bullishly-inclined, he or she will find good reasons to buy from the data - and vice versa.
It is the same process when buying shoes or bread or any act of purchase. It is the sentiment already felt that motivates the individual to act a certain way.
There is no doubt that sentiment towards has been generally bearish overall. From the 2010 Gulf oil spill disaster to the recent slide in crude prices, the news has been unrelentingly negative for the company.
The extensive media coverage of the Gulf oil spill has cast BP as one of the most hated companies in the USA - not the usual background for a booming stock chart!
Here is the weekly price chart showing the collapse in 2010:
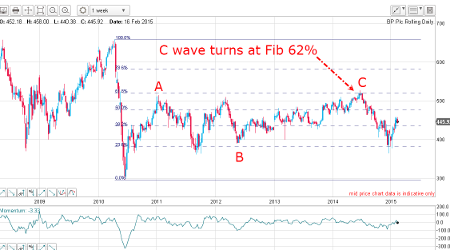
The plunge more than halved the share price, but since the low of June 2010, the market has made a faltering recovery with wide overlapping waves, which is usually a sign of a counter-trend relief rally prior to the resumption of the downtrend.
I can label the big waves as A-B-C (see text pp 89-90, 97-104), which is a signature of a corrective move. The whole pattern has developed in a little over four years.
But the critical feature is that the C wave high made an accurate reversal from the 520p level, which is the Fibonacci 62% retrace of the entire 2010 plunge wave.
BP makes an accurate hit on Fibonacci 62% level
I have found that when I can identify a clear A-B-C corrective pattern following a clear motive five wave pattern, the C wave usually extends to the Fibonacci 62% level - and with this example, the hit was highly accurate.
That was the ideal spot either to take profits on longs and/or establish new short positions.
But, of course, that hit occurred in the summer last year - precisely the time when crude started its massive slide. Naturally, BP shares joined in the sell-off.
But what can the daily chart action from last summer's high tell us?

I have a complete five-wave motive swing down to the December low. Wave 1 has the required mini-five wave motive pattern within (this pattern is very clear), while Wave 3 is not as long as is customary but it is certainly strong (which is a requirement of a third wave).
Wave 5 is stronger than wave 3 (weaker momentum), which is fairly unusual and has a three-wave pattern - also unusual.
Then this year, I have another lovely A-B-C corrective rally where the C wave, put in last week, has made what is by now a customary accurate hit on the Fibonacci 62% retrace level!
Isn't that a stunning "coincidence"?
Incidentally, the above chart is a textbook example showing how price charts are patterned according to the Elliott wave model. The waves are simply an expression of the ebb and flow of investor sentiment (see above).
Understanding the basics of the Elliott wave theory will definitely give you an edge. We had a stunning short opportunity last summer, and we may have another one here.
Here is a close-up on the hourly chart:
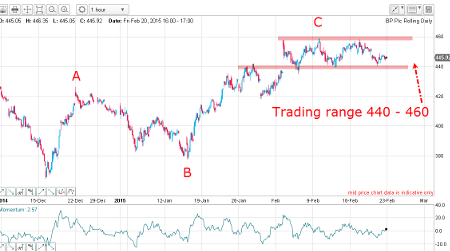
Outlook
The C wave is making a tight trading range between 440 and 460. Breaking out of this range would indicate the next larger move. If my labels are correct, it should break to the downside and re-engage with the long-term downtrend.
But if crude can catch a bid near-term, a rally to the Fibonacci 78% level at the 490 area would be on the cards.
Currently, the odds favour a break to the downside. Placing stop orders to enter on a break out of the trading channel appears sensible.
These articles are provided for information purposes only. Occasionally, an opinion about whether to buy or sell a specific investment may be provided by third parties. The content is not intended to be a personal recommendation to buy or sell any financial instrument or product, or to adopt any investment strategy as it is not provided based on an assessment of your investing knowledge and experience, your financial situation or your investment objectives. The value of your investments, and the income derived from them, may go down as well as up. You may not get back all the money that you invest. The investments referred to in this article may not be suitable for all investors, and if in doubt, an investor should seek advice from a qualified investment adviser.
Full performance can be found on the company or index summary page on the interactive investor website. Simply click on the company's or index name highlighted in the article.
Disclosure
We use a combination of fundamental and technical analysis in forming our view as to the valuation and prospects of an investment. Where relevant we have set out those particular matters we think are important in the above article, but further detail can be found here.
Please note that our article on this investment should not be considered to be a regular publication.
Details of all recommendations issued by ii during the previous 12-month period can be found here.
ii adheres to a strict code of conduct. Contributors may hold shares or have other interests in companies included in these portfolios, which could create a conflict of interests. Contributors intending to write about any financial instruments in which they have an interest are required to disclose such interest to ii and in the article itself. ii will at all times consider whether such interest impairs the objectivity of the recommendation.
In addition, individuals involved in the production of investment articles are subject to a personal account dealing restriction, which prevents them from placing a transaction in the specified instrument(s) for a period before and for five working days after such publication. This is to avoid personal interests conflicting with the interests of the recipients of those investment articles.