Chart of the week: BT Group and the FTSE 100
15th June 2015 12:57
by John Burford from interactive investor
Share on
By John C Burford, author of Tramline Trading, and editor of MoneyWeek Trader
In these weekly articles, I will highlight a share that I believe has an interesting chart pattern. I am primarily a technical trader and use the methods I have developed that I call Tramline Trading. You can read more about my methods in my book Tramline Trading, which you can inspect here.
Most traders and investors make classic errors by chasing a stock near a top and then hang on to it too long during the decline. You will vastly improve your performance by timing your entries and exits more expertly - and that is what I hope to help you with.
My goal in these articles is to cover a share that has an interesting chart. I developed my tramline system over several years to give me a set of rules which can provide me with trade entries at low risk. The low risk requirement was crucially important because no matter how firmly I believe in my trade, I could be wrong! And I wanted my wrong trades to hand me the smallest possible loss to my account. I figured the winners would take care of themselves.
My hope is that you glean useful ideas and employ at least some technical analysis to bolster your returns. In trading as well as investing, timing is a key factor in your eventual returns.
BT update
I covered back in December and I thought I would give it a six-month check-up. Naturally, for the venerable "dinosaur" that was the monopoly telecom provider in the UK, privatised thirty years ago and turns over £18 billion, the shares do not mimic a dotcom start-up with wild speculative swings up and down.
Actually, during the dotcom frenzy in the late 1990s, BT was caught up in the mania for any company that had a website. That pushed up the share price to over £12 - a value totally unjustified by its business model.
And when the credit crunch hit, the shares were knocked sideways and hit a low of 71p in 2009 and have been recovering since then. That was the buying opportunity of the decade.
So today, I want to review what I had forecast in December.
Here is the long-range chart I had then:
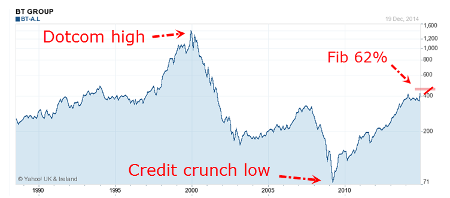
The shares were trading around the 400p area and heading towards the Fibonacci 62% level (as marked). And here is the updated shorter-term chart:
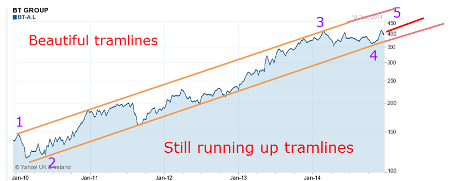
As I had forecast, the market has obeyed my tramline trading rule which states that when you have a reliable tramline pair, the market will follow in that direction until one of the tramlines is broken. And in six months, the tramlines are intact.
What is especially satisfying is shown in the shorter-term chart. Here is the chart I published back in December showing the textbook wedge formation:
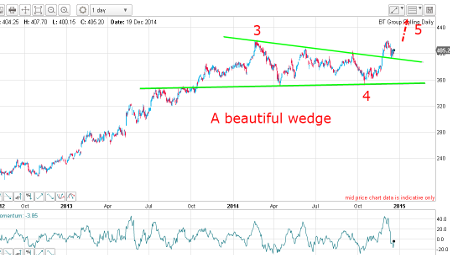
This wedge had taken over fifteen months to form - an unusually long time. That gave me a clue that the upward move out of it would be vigorous. And this is what happened after December:
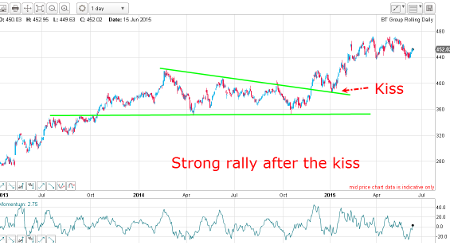
Following the wedge line upward break in December, the market came back and planted a traditional kiss on the line and then took off in the vigorous rally I had forecast.
The important point is that the upper green wedge line represented resistance to rallies before the break, but was transformed into a line of support to declines afterwards. That was proven by the kiss and the upwards thrust in January.
A long trade taken at the 400 area six months ago would now be in profit by 12%. For a staid widows and orphans stock, that isn’t bad.
So let's zoom in even closer:
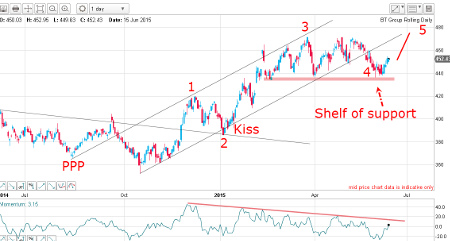
This chart shows the thrust out of the wedge and it has occurred inside the trading channel contained by my tramline pair - until a few days ago when there was a tramline break.
That took the market down to the 440 level, which is a shelf of support. And that is my wave 4 low.
Outlook
I have a very large momentum pattern forming. If the market can thrust up from here, that would break my momentum trendline and the market will rally above the previous high in the 470 area. That would likely be my wave 5.
And because the market is entering the Fibonacci 62% resistance level, further gains after that will likely be hard-won.
Of course, it is always a good idea to keep your eye on general market conditions, and for that we turn to the index - and here it is:

The market has broken down out of the wedge at the top and is testing the support shelf today. Breaking below that support would herald further declines, and may put pressure on BT. However, because BT is considered a defensive share, it could well be accumulated on any general weakness as investors rotate out of the high-flyers.
These articles are provided for information purposes only. Occasionally, an opinion about whether to buy or sell a specific investment may be provided by third parties. The content is not intended to be a personal recommendation to buy or sell any financial instrument or product, or to adopt any investment strategy as it is not provided based on an assessment of your investing knowledge and experience, your financial situation or your investment objectives. The value of your investments, and the income derived from them, may go down as well as up. You may not get back all the money that you invest. The investments referred to in this article may not be suitable for all investors, and if in doubt, an investor should seek advice from a qualified investment adviser.
Full performance can be found on the company or index summary page on the interactive investor website. Simply click on the company's or index name highlighted in the article.
Disclosure
We use a combination of fundamental and technical analysis in forming our view as to the valuation and prospects of an investment. Where relevant we have set out those particular matters we think are important in the above article, but further detail can be found here.
Please note that our article on this investment should not be considered to be a regular publication.
Details of all recommendations issued by ii during the previous 12-month period can be found here.
ii adheres to a strict code of conduct. Contributors may hold shares or have other interests in companies included in these portfolios, which could create a conflict of interests. Contributors intending to write about any financial instruments in which they have an interest are required to disclose such interest to ii and in the article itself. ii will at all times consider whether such interest impairs the objectivity of the recommendation.
In addition, individuals involved in the production of investment articles are subject to a personal account dealing restriction, which prevents them from placing a transaction in the specified instrument(s) for a period before and for five working days after such publication. This is to avoid personal interests conflicting with the interests of the recipients of those investment articles.