Chart of the week: A big test for this share
3rd August 2015 12:54
by John Burford from interactive investor
Share on
By John C Burford, author of Tramline Trading, and editor of MoneyWeek Trader
In these weekly articles, I will highlight a share that I believe has an interesting chart pattern. I am primarily a technical trader and use the methods I have developed that I call Tramline Trading. You can read more about my methods in my book Tramline Trading, which you can inspect here.
Most traders and investors make classic errors by chasing a stock near a top and then hang on to it too long during the decline. You will vastly improve your performance by timing your entries and exits more expertly - and that is what I hope to help you with.
My goal in these articles is to cover a share that has an interesting chart. I developed my tramline system over several years to give me a set of rules which can provide me with trade entries at low risk. The low risk requirement was crucially important because no matter how firmly I believe in my trade, I could be wrong! And I wanted my wrong trades to hand me the smallest possible loss to my account. I figured the winners would take care of themselves.
My hope is that you glean useful ideas and employ at least some technical analysis to bolster your returns. In trading as well as investing, timing is a key factor in your eventual returns.
Three updated charts
Today, I have updates on three shares I have been covering in previous issues.
Update on Ashtead Group
I have been covering this share on several occasions and noted it has been in a strong bull market for some time - and showing textbook bull market behaviour.
In my email of June 22, I showed this daily chart:
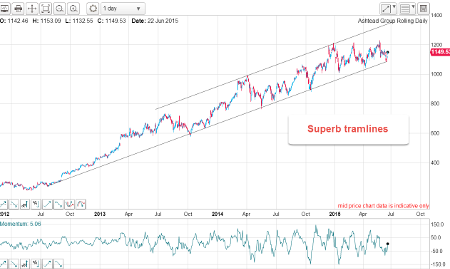
(click to enlarge)
The rally was travelling nicely upwards in the trading channel contained by my excellent tramlines. So far, so good. But no market remains in a rally for ever.
The key for capturing (and banking profits) of a large part of a rally is knowing when to take at least partial profits off the table - and that is what my tramline method offers, as I will show.
It is no good only getting in fairly early on a bull trend - the harder part is knowing when to exit. Many investors make the horrible mistake of riding a share up - and then down again. I call those elevator trades. Sadly, there is no bell ringing at tops, so you must have a sensible exit strategy in place and in advance. This is what we call disciplined trading - and I recommend it highly.
This was my conclusion back on June 22: "The bull run is intact and new highs appear very likely. But if the lower tramline is broken all bets are off, but at present the bull continues to have the upper hand."
And this is today's updated chart:
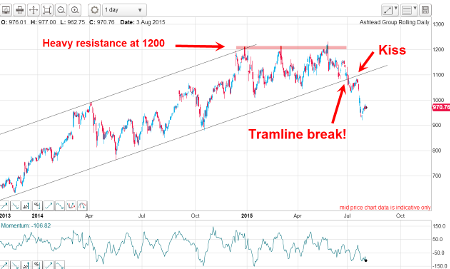
(click to enlarge)
And in early July, the market did indeed make a sharp break of the lower tramline - and that was the signal to act! A few days later, it staged a dead cat bounce to try for a kiss on the underside of the line. That is an entirely common procedure before the market peeled away in a scalded cat bounce (a sharp move away from the line, which is now resistance).
Note the difference between a scalded cat and a dead one! In the former, the cat is very much alive, but running for its life away from the hot water.
An investor in would then have had a clear rationale for taking at least some profits off the table. Note that the decline since the break has been very sharp - a sure consequence of the long-established tramlines which necessarily induce a heightened state of complacency.
Remember, high complacency = eventual huge disappointment.
Update on Aberdeen Asset Management
I last covered Aberdeen Asset Management on July 6 and this was the chart then:
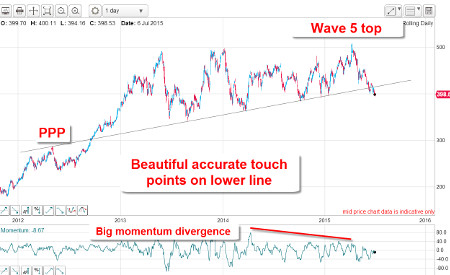
(click to enlarge)
I noted the superb line joining the lows which represented support: every time the market retreated to that line, it was met by buying which pushed it back up. Until early July, that is, when the market was in the throes of testing that support.
I noted the Elliott Wave pattern and labelled the 600p new high made April 13 was likely the final top of wave 5. This is what I wrote then: "Now the market is off by over 22% within the last three months and officially in a bear market. The outlook is far from bullish."
And how right I was - here is the updated chart:
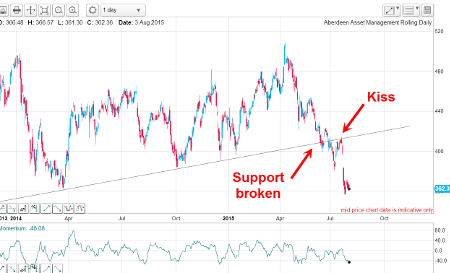
(click to enlarge)
The support was broken, a kiss was planted and the market is now in a scalded cat bounce down. This action is uncannily similar to that in the Ashtead chart. Investors beware!
Update on Burberry
As a fashion brand, has been riding high along with the general stock markets with China being an engine of growth - until recently. With the hard Chinese landing now in progress, demand for luxury items has been waning (along with its stock market).
This was the chart I showed on July 6:

(click to enlarge)
I noted the A-B-C pattern with the market then testing the lower tramline. This is what I wrote then: "In the near term, the market is very oversold and the tramline support is still holding. A near-term bounce is likely, but with the turmoil set off by yesterday's eurozone events, I would not rule out further declines to come."
And this is the current chart showing little change, as the test of support continues:
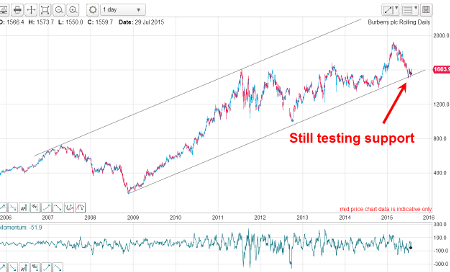
(click to enlarge)
But if that support does give way soon, the decline could be severe.
As an indication, take a look at this chart showing the US luxury index:
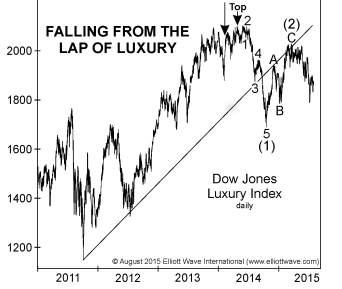
chart courtesy www.elliottwave.com
To me, this chart is showing a clear weakening trend that is likely to accelerate in the weeks and months ahead.
UK fashion brands will not be immune to this development.
These articles are provided for information purposes only. Occasionally, an opinion about whether to buy or sell a specific investment may be provided by third parties. The content is not intended to be a personal recommendation to buy or sell any financial instrument or product, or to adopt any investment strategy as it is not provided based on an assessment of your investing knowledge and experience, your financial situation or your investment objectives. The value of your investments, and the income derived from them, may go down as well as up. You may not get back all the money that you invest. The investments referred to in this article may not be suitable for all investors, and if in doubt, an investor should seek advice from a qualified investment adviser.
Full performance can be found on the company or index summary page on the interactive investor website. Simply click on the company's or index name highlighted in the article.
Disclosure
We use a combination of fundamental and technical analysis in forming our view as to the valuation and prospects of an investment. Where relevant we have set out those particular matters we think are important in the above article, but further detail can be found here.
Please note that our article on this investment should not be considered to be a regular publication.
Details of all recommendations issued by ii during the previous 12-month period can be found here.
ii adheres to a strict code of conduct. Contributors may hold shares or have other interests in companies included in these portfolios, which could create a conflict of interests. Contributors intending to write about any financial instruments in which they have an interest are required to disclose such interest to ii and in the article itself. ii will at all times consider whether such interest impairs the objectivity of the recommendation.
In addition, individuals involved in the production of investment articles are subject to a personal account dealing restriction, which prevents them from placing a transaction in the specified instrument(s) for a period before and for five working days after such publication. This is to avoid personal interests conflicting with the interests of the recipients of those investment articles.