Chart of the week: Start of a rally for Shell
5th October 2015 12:44
by John Burford from interactive investor
Share on
By John C Burford, author of Tramline Trading, and editor of MoneyWeek Trader
In these weekly articles, I will highlight a share that I believe has an interesting chart pattern. I am primarily a technical trader and use the methods I have developed that I call Tramline Trading. You can read more about my methods in my book Tramline Trading, which you can inspect here.
Most traders and investors make classic errors by chasing a stock near a top and then hang on to it too long during the decline. You will vastly improve your performance by timing your entries and exits more expertly - and that is what I hope to help you with.
My goal in these articles is to cover a share that has an interesting chart. I developed my tramline system over several years to give me a set of rules which can provide me with trade entries at low risk. The low risk requirement was crucially important because no matter how firmly I believe in my trade, I could be wrong! And I wanted my wrong trades to hand me the smallest possible loss to my account. I figured the winners would take care of themselves.
My hope is that you glean useful ideas and employ at least some technical analysis to bolster your returns. In trading as well as investing, timing is a key factor in your eventual returns.
Royal Dutch Shell moves up off the floor
I covered some time back and it has languished - until last week, that is. The share has suddenly sprung to life and is poised to move significantly higher.
The wave pattern is, like in (see bottom of this article), a completed five down off its high last summer. This is my Elliott wave count and is slightly unconventional in that my wave 5 is much longer than my third wave. In fact, the fifth wave is what I call an extended fifth and is not an unusual feature in many large cap shares, especially if they are in the commodity sector.
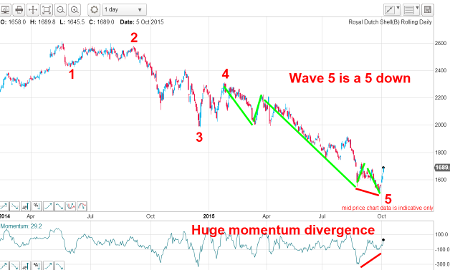
But the essential features are there: waves 2 and 4 (counter-trend waves) are A-B-C three up and waves 3 and 5 are both composed of five down. I have drawn in the five waves of wave 5 in green and there is a clear and huge momentum divergence between waves 3 and 5 within wave 5. This is a sign that the selling has been overdone and to expect a large counter-trend rally ahead. We appear at the start of that rally.
And looking at the short term hourly chart, I see several bullish features:
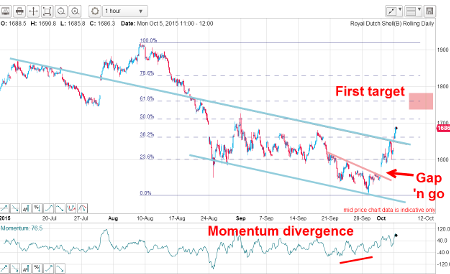
I have a good tramline pair in blue. Last week, the market moved up off the momentum divergence with a "gap 'n go" above the short term tan trendline. This "gap 'n go" pattern often appears when an oversold market experiences massive short covering, especially in the underlying commodity (crude oil has moved up off its recent lows) - and catches most by surprise.
That was certainly the case when Shell announced it was giving up drilling in the Arctic, having burned through several billions. But that was when the market made its low and set the bear trap.
Today, the shares have punched above the upper tramline and my next immediate target is the Fibonacci 62% area.
Outlook
Crude oil has the potential to rally to at least the $60 area and if so, Shell will likely hit the £20-£22 zone and possibly higher.
Update on Randgold
With the sharp rally in the gold and silver (PM) prices (and stockmarkets) on Friday following the utterly dreadful US economic data, gold miners such as Randgold naturally rallied alongside. Such is the twisted logic of market participants that a worsening economy is great news for stocks.
By the same token, it was also good for PMs. Go figure. But the important point is that we flagged these likely rallies days ago by virtue of reading the charts. I had no idea (nor did anyone else) that Friday's data would be so poor - for all I knew, the data would just as plausibly have turned out 'good'. What would the markets have done in this case?
Recall last time, I had a complete (or nearly so) five-wave count down off the February high and with that, I was pretty confident that the low was nigh and a terrific rally lay just ahead.
This is the daily chart this morning:
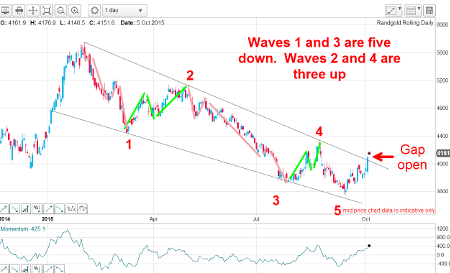
Previously, I noted the five down within a large wedge. In pure textbook fashion, the motive waves (in same direction as main trend) 1 and 3 were both composed of their own five down patterns (tan bars). And the counter-trend waves 2 and 4 were both three down (green bars). If I was asked to provide an ideal real-life example of a complete motive five-wave Elliott pattern that follows all the rules and guidelines, I could scarcely do better than this one.
With confidence high that a rally was in store, the market this morning has gapped up above my upper wedge line - and this is a very bullish sign.
But to increase confidence even further, I will need to see a move above the wave 4 high soon. But a failure here where the market drops back below the upper wedge line would cast doubt on the market's ability to rally near-term.
But so long as my wave 5 at the £36 level holds, odds remain good for a substantial rally in the next few weeks with the £50 area a target.
These articles are provided for information purposes only. Occasionally, an opinion about whether to buy or sell a specific investment may be provided by third parties. The content is not intended to be a personal recommendation to buy or sell any financial instrument or product, or to adopt any investment strategy as it is not provided based on an assessment of your investing knowledge and experience, your financial situation or your investment objectives. The value of your investments, and the income derived from them, may go down as well as up. You may not get back all the money that you invest. The investments referred to in this article may not be suitable for all investors, and if in doubt, an investor should seek advice from a qualified investment adviser.
Full performance can be found on the company or index summary page on the interactive investor website. Simply click on the company's or index name highlighted in the article.
Disclosure
We use a combination of fundamental and technical analysis in forming our view as to the valuation and prospects of an investment. Where relevant we have set out those particular matters we think are important in the above article, but further detail can be found here.
Please note that our article on this investment should not be considered to be a regular publication.
Details of all recommendations issued by ii during the previous 12-month period can be found here.
ii adheres to a strict code of conduct. Contributors may hold shares or have other interests in companies included in these portfolios, which could create a conflict of interests. Contributors intending to write about any financial instruments in which they have an interest are required to disclose such interest to ii and in the article itself. ii will at all times consider whether such interest impairs the objectivity of the recommendation.
In addition, individuals involved in the production of investment articles are subject to a personal account dealing restriction, which prevents them from placing a transaction in the specified instrument(s) for a period before and for five working days after such publication. This is to avoid personal interests conflicting with the interests of the recipients of those investment articles.