Chart of the week: A gutsy forecast for FTSE 100
11th January 2016 12:24
by John Burford from interactive investor
Share on
With one of the biggest New Year losses on record, I will update my take on the index. Many investors are invested in this index in a tracker fund and it is the most widely-quoted stock index. Incidentally, I also trade it in my spread betting and CFD accounts.
The chart from the depths of the 2009 is below.
The 2009-2015 bull market is a very large B wave (purple) which comprises a red A-B-C form. Waves A and C both sport five motive waves up.
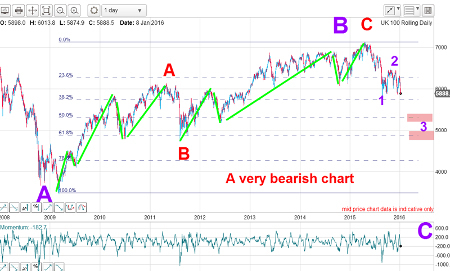
(Click to enlarge)
The implication of this pattern is that when the purple B/red C waves top out (as I believe they have), the market will embark on a large C wave down, which should not end until the A wave low at the 3,500 area is breached.
I will gain more confidence in this forecast when my wave 1 low at the 5,770 level is taken out. In the meantime, the market has potential to put in some large up and down waves.
I recognise that this is a gutsy forecast, but I have had it for many months (when it was considered so far out in left field that I was considered less than sane). But with the FTSE losing altitude like a burst weather balloon, this view appears suddenly to be slightly less preposterous.
I have marked my near-term targets at the Fibonacci levels shown. Remember, third waves are usually long and strong so they could be reached sooner than most can appreciate today.
But we shall see some sharp, but brief, rallies on this road - and these will be opportunities to position short.
Update on Randgold
Since I last covered on 7 December, the shares have been moving higher according to my near-term forecast.
Of course, with the turmoil in the rest of the stockmarket taking centre stage in the mainstream media, gold and the gold miners have attracted buying attention (and some short covering) in the first trading week of the New Year.
Many are saying that with the almost assured prospect of rising US interest rates this year, gold prices (and hence the miners) cannot rally in dollar terms. They claim that rising rates are always bearish for gold. This is a total myth. The proof? For instance, from 2003 to 2007, gold doubled from $350 to $700 - and US T-Bill yield rose from 1% to 5%, a five-fold increase!
Then, from 2007 to 2009, gold rose from $700 to nearly $1,000, while T-Bill yields fell from 5% back to 1%.
Some correlation! And this myth is based on the false (but "obvious") statement that gold pays no interest. I say: So what?
When most money managers are lined up bearish on gold - and knowing it has endured a brutal 50-month 40% bear market off its October $1,920 top - I am happy to take the other side of that bet, thank you.
Here is the daily chart I showed last time:
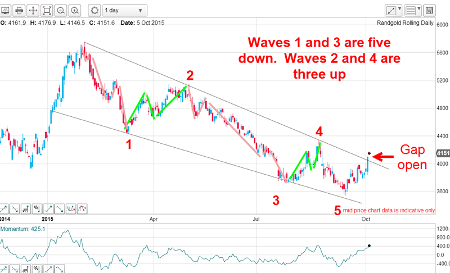
(Click to enlarge)
My wave labels suggested that the £36 low was the final wave 5 low and that the break of my upper wedge line on 7 December was the start of a recovery bull run.
Here is that chart updated:
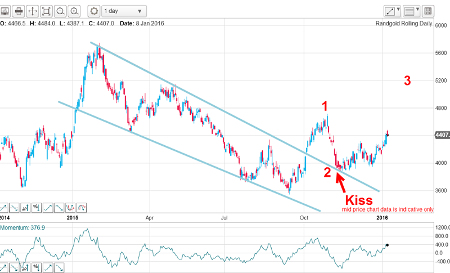
(Click to enlarge)
The upper wedge line, which was a line of resistance before that upward break, now became a line of support, which was amply tested when the market came back to plant a kiss on it - and was immediately repulsed in a scalded-cat bounce. And that kiss was an ideal place to take a long position - and to enter a close protective stop to give you a very low-risk trade.
In fact, the kiss trade is one of my top trading setups. It is working here because the upper tramline is of high reliability and that is because I have four very accurate touch points (three is my minimum for high reliability).
So how does the bigger picture stack up? Here is the weekly chart going back to 2010:
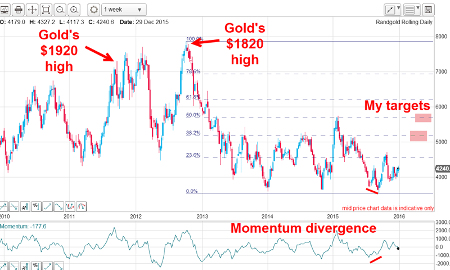
(Click to enlarge)
One major point to note is that when gold made its all-time high at $1,920 in 2011, Randgold was trading near its £75 highs. One year later, when gold was trading $100 lower, Randgold shares shot higher to the £80 area despite the lower gold price. That is a noteworthy divergence - and that realisation woke the market up to the fact that it had mis-priced the shares and they quickly corrected down at a rate of knots.
So, today, following the momentum divergence at the major £36 support level, I have marked my Fibonacci targets at the £52 and then the £58 area - which is at the early 2015 high.
Outlook
Trend is now up, although we could see one more dip, which would provide another buying opportunity.
This article is for information and discussion purposes only and does not form a recommendation to invest or otherwise. The value of an investment may fall. The investments referred to in this article may not be suitable for all investors, and if in doubt, an investor should seek advice from a qualified investment adviser.
These articles are provided for information purposes only. Occasionally, an opinion about whether to buy or sell a specific investment may be provided by third parties. The content is not intended to be a personal recommendation to buy or sell any financial instrument or product, or to adopt any investment strategy as it is not provided based on an assessment of your investing knowledge and experience, your financial situation or your investment objectives. The value of your investments, and the income derived from them, may go down as well as up. You may not get back all the money that you invest. The investments referred to in this article may not be suitable for all investors, and if in doubt, an investor should seek advice from a qualified investment adviser.
Full performance can be found on the company or index summary page on the interactive investor website. Simply click on the company's or index name highlighted in the article.
Disclosure
We use a combination of fundamental and technical analysis in forming our view as to the valuation and prospects of an investment. Where relevant we have set out those particular matters we think are important in the above article, but further detail can be found here.
Please note that our article on this investment should not be considered to be a regular publication.
Details of all recommendations issued by ii during the previous 12-month period can be found here.
ii adheres to a strict code of conduct. Contributors may hold shares or have other interests in companies included in these portfolios, which could create a conflict of interests. Contributors intending to write about any financial instruments in which they have an interest are required to disclose such interest to ii and in the article itself. ii will at all times consider whether such interest impairs the objectivity of the recommendation.
In addition, individuals involved in the production of investment articles are subject to a personal account dealing restriction, which prevents them from placing a transaction in the specified instrument(s) for a period before and for five working days after such publication. This is to avoid personal interests conflicting with the interests of the recipients of those investment articles.