Chart of the week: A low-risk buying opportunity
1st February 2016 13:40
by John Burford from interactive investor
Share on
Time to buy unloved Babcock?
One share I have been keeping an eye on is . It is an engineering and outsourcing company very much tied to the UK defence sector, with the Ministry of Defence its biggest single customer - and its possible Achilles heel. Its annual revenue is around £4 billion and there's an order book of £12 billion.
On the face of it, the shares should be one of the more reliable low risk investments, but it has been in a downturn for the past two years, having lost 40% in that time.
But, once again, it is the chart pattern that appears compelling to me. Here is the long-range weekly chart:
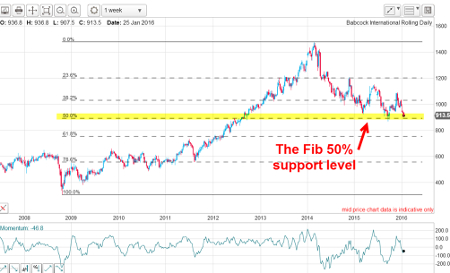
The market entered a steep rally phase off its 2008 credit crunch low to the 1,475p February 2014 top. Since then, the decline has taken it right to the Fibonacci 50% support zone. In true textbook fashion, the market bounced off this support last September and is currently testing that level once more.
This is the moment of truth - will the current support in the 900-910p area hold or give way? If it does break, the next support level is the Fibonacci 62% level at around the 750p area.
For clues, here is the daily chart showing the two-year decline:
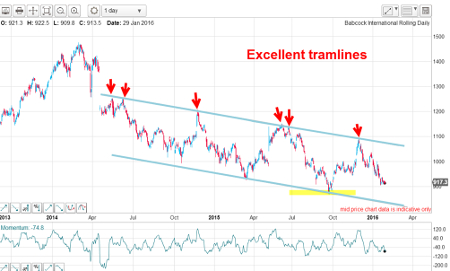
This decline has been very orderly and within the trading channel between my tramlines. The upper tramline is particularly impressive, with six highly accurate touch points. Remember, the greater the number of accurate touch points on a line, the more confidence you can place on that line as either support or resistance.
So now let's examine a close up of recent trading:
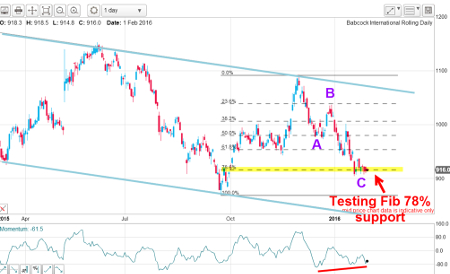
The internal waves are quite complex, but with the market having hit the Fibonacci 78% support - which is usually the last line of defence - the potential is there for a rally. There is a small momentum divergence here which could be a force driving that rally.
So far, the latest decline off my upper tramline is an A-B-C, which implies the next move will be up.
Outlook
A long position here would present a low-risk opportunity. That is so because, if the market does continue its decline back towards the lower tramline (and the 750p level - see above), a long trade could be protected by a very close stop loss. Taking small losses is a major part of a winning strategy!
A move up from this level past the 940p level would confirm the uptrend - and an eventual assault on the 1,060p area at the upper tramline.
Update on Randgold
All of a sudden, the big miners are back in fashion. In the second half of last year, you couldn't give them away! And that is when I started drawing attention to the upside possibilities.
It's no use buying when everyone else is doing just that - you have usually entered a bull trap. I wrote last year that gold miners, then out of favour, represented a great trading opportunity - but probably not a long-term investment.
With the gold market starting to catch fire, has likewise woken up. Here is the latest chart:
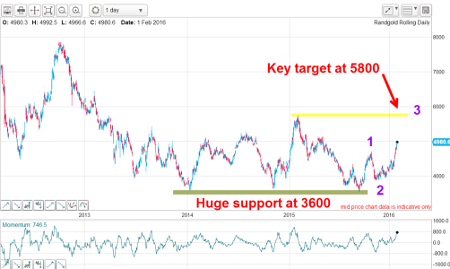
The shares formed a huge base of support at the 3,600p level for almost two years and this base should be the fuel to propel the shares in a large wave 3 up (third waves are usually long and strong).
Outlook
The market has hit an important Fibonacci 62% resistance level at this morning's 5,000p level and, for traders or investors who like to take some short-term profits, this would be a good place to consider this option. It appears the main trend, however, is now up and the market should eventually challenge the key 5,800p level in due course.
Update on Tesco
I have been expecting a counter-trend rally in since I last covered it - and the market is duly obliging:
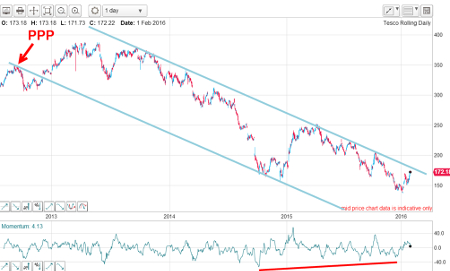
Here are my lovely tramlines. The upper tramline contains multiple accurate touch points, making it a very reliable line of resistance. The market made new lows around 140p early last month and is rallying off the momentum divergence in an A-B-C (so far).
At the current 172p print, the market is fast approaching my upper tramline, where strong resistance lies.
If the market can catch a bid and move firmly above the upper tramline in the 180p area soon, then the outlook is for further gains - perhaps to the 200p area, with higher potential possible.
This article is for information and discussion purposes only and does not form a recommendation to invest or otherwise. The value of an investment may fall. The investments referred to in this article may not be suitable for all investors, and if in doubt, an investor should seek advice from a qualified investment adviser.
These articles are provided for information purposes only. Occasionally, an opinion about whether to buy or sell a specific investment may be provided by third parties. The content is not intended to be a personal recommendation to buy or sell any financial instrument or product, or to adopt any investment strategy as it is not provided based on an assessment of your investing knowledge and experience, your financial situation or your investment objectives. The value of your investments, and the income derived from them, may go down as well as up. You may not get back all the money that you invest. The investments referred to in this article may not be suitable for all investors, and if in doubt, an investor should seek advice from a qualified investment adviser.
Full performance can be found on the company or index summary page on the interactive investor website. Simply click on the company's or index name highlighted in the article.
Disclosure
We use a combination of fundamental and technical analysis in forming our view as to the valuation and prospects of an investment. Where relevant we have set out those particular matters we think are important in the above article, but further detail can be found here.
Please note that our article on this investment should not be considered to be a regular publication.
Details of all recommendations issued by ii during the previous 12-month period can be found here.
ii adheres to a strict code of conduct. Contributors may hold shares or have other interests in companies included in these portfolios, which could create a conflict of interests. Contributors intending to write about any financial instruments in which they have an interest are required to disclose such interest to ii and in the article itself. ii will at all times consider whether such interest impairs the objectivity of the recommendation.
In addition, individuals involved in the production of investment articles are subject to a personal account dealing restriction, which prevents them from placing a transaction in the specified instrument(s) for a period before and for five working days after such publication. This is to avoid personal interests conflicting with the interests of the recipients of those investment articles.