Why market may fall another 18%
8th February 2016 11:15
by Lance Roberts from ii contributor
Share on
Head and shoulders
The good news, if you want to call it that, is that the market is currently holding above the recent lows, as short-term oversold conditions once again approach. It is critically important that the market holds above that support - which is also the neckline of the current "head and shoulders" formation - as a break would lead to a more substantive decline.
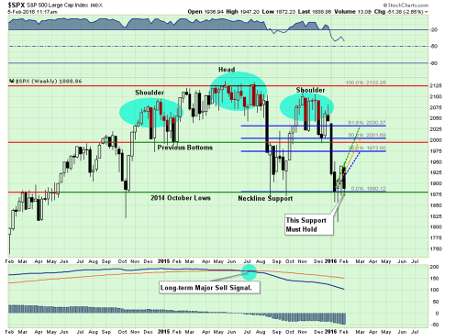
However, this isn't the first time that we have seen a "head and shoulders" topping pattern form combined with a long-term major sell signal as shown above.
I emphasize this point because many short-term technicians point out "head and shoulders" formations that consistently do not lead to more important declines. However, when this topping process combines with enough deterioration in the markets to issue long-term "sell signals," it is something worth paying attention to.
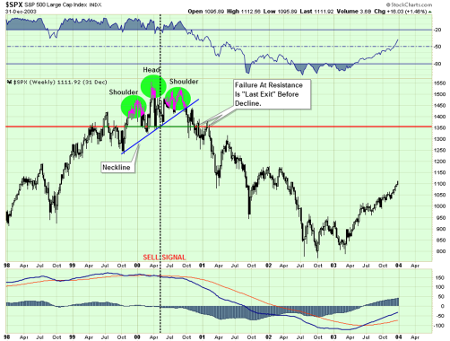
The first chart shows the same development in 2000:
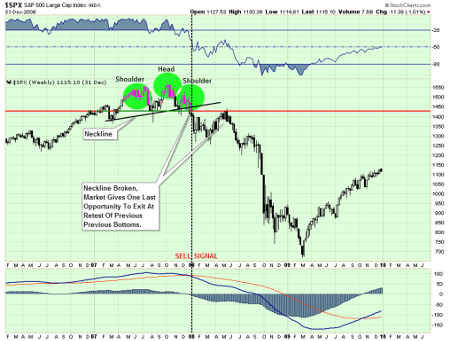
And again in 2007:
These are the only two points since the turn of the century where a topping process was combined with a long-term sell signal.
It is important to note that, in both previous cases, the markets did provide one last chance to exit before a more substantive decline ensued. This is because by the time the market has declined enough to break the neckline, sellers have been temporarily exhausted. This allows the market to rise enough to test previous resistance where "sellers" once again emerge.
It is very likely that if, or when, the market breaks current neckline support, individuals will be given one last chance to exit the markets for safer ground. A failure to do so has previously been the start of the "trail of tears".
Predicting or paying attention?
Last night I gave a presentation to a group of doctors discussing the economy, the markets and what is most likely to come over the next few months.
One of the questions I was asked during the Q&A section was:
"How can you be so sure that you are right? No one can time the market."
It is an interesting question, and one that I have been asked before. If you scroll down to the bottom of this report you will see a chart of the S&P 500 with the history of portfolio adjustments over time. You could call this timing - however, I prefer to call this risk management.
Currently, every single measure is registering a 'sell' signalFor me, "timing the market" is trying to be "all in" or "all out". If you try and do that playing poker you are eventually going to go broke.
However, a good poker player understands the "risk of losing" given the particular hand that they are dealt. They will bet much heavier given a "full house" versus a "pair of deuces". However, even given a great hand, a good poker player reads the other players at the table and adjusts their bets accordingly.
The same is true when it comes to managing your portfolio. While you may have a "great hand of stocks", you must read the rest of the players in the market. If they are all buying or selling - then what do they know that you possibly don't?
Major decline may have started already
So, that brings me to the question above. I am not sure that I am right.
However, since last May I have held exposure in portfolios to 50% of normal equity allocations because the price trends of the market have been deteriorating. Furthermore, they continue to do so, which is leading me to reduce allocations even more.
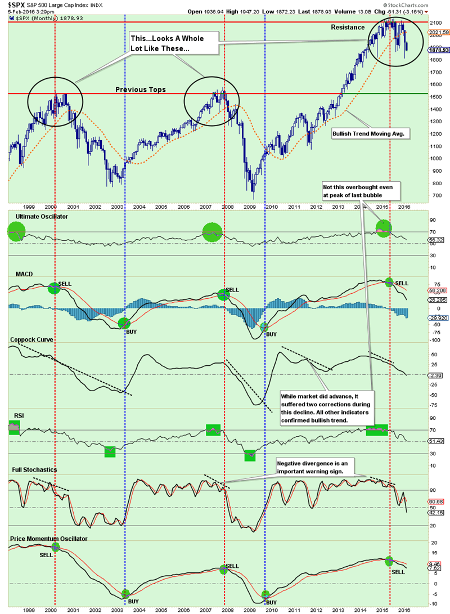
Am I predicting a major market decline? No. However, I am suggesting, given the current weight of evidence, that one may very likely already be in process. The chart below is a monthly chart of market indicators that measure a variety of market internals.
Currently, every single measure is registering a 'sell' signal, which has only occurred during the previous two bull market cycles.
Now, you can certainly make the case for why "this time is different". However, if you are a good poker player, should you really be betting heavily, given the current hand?
Even if a correction only reverts to the previous peaks of the past two bull markets, such would entail an additional decline of 18% from current levels, or 27% from the previous peak. Such a correction would just about meet the average draw down of a bear market cycle throughout history, as shown in the table below.
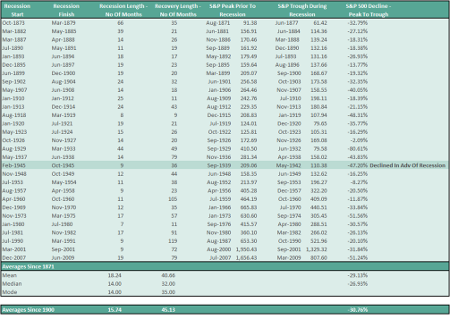
Are you ready for that?
This article is for information and discussion purposes only and does not form a recommendation to invest or otherwise. The value of an investment may fall. The investments referred to in this article may not be suitable for all investors, and if in doubt, an investor should seek advice from a qualified investment adviser.
Lance Roberts is a Chief Portfolio Strategist/Economist for Clarity Financial. He is also the host of "The Lance Roberts Show" and Chief Editor of the "Real Investment Advice" website and author of The "Real Investment Daily" blog and the "Real Investment Report". Follow Lance on Facebook, Twitter and Linked-In