Here's where Barclays shares may bottom
11th February 2016 10:38
by Alistair Strang from Trends and Targets
Share on
The last time we featured was in November last year. At the time, it was trading around the 230p level and we provided criteria for it shuffling down to 151p. Given the share managed 154p earlier this week, hopefully that will prove close enough and a bounce will be experienced.
We have a serious problem with this, should it close below 151p, as that number is supposed to be "ultimate bottom" on this trading cycle. Closure below means we need to look at reversals powered by the highs from 2010, meaning we shall complete this report with some really grotty numbers.
For now, let's pretend confidence as, at time of writing (Wednesday night), the share price has bounced unconvincingly from 154 to 162p. The burning question is: what's needed to signal it's actually going up?
Thankfully, not too much action is required. It now needs better than 164p just to signal it has probably found a bottom and further growth to a useless 168p can be hoped for. The secondary, if such a level is bettered, calculates at 176p.
The important thing with this tier of numbers isn't the numbers themselves, but rather how the price reacts with them, as we're trying to gauge the strength of movements. The harsh reality with Barclays is that the price is regarded as trashed, due to it trading below the final uptrend since 2009.
Only in the event of the price closing a session above red (181.047p currently) will we relax. The funny thing comes when we view the rate of decline thus far in 2016. If we draw a line through the daily highs, it appears our calculation of 176p would bash into the immediate downtrend some time in the days ahead.
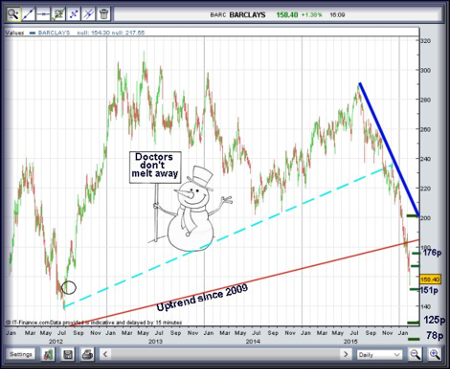
The implication behind this is that, should our 176p thing be bettered later next week, it will be the first signal Barclays has perhaps imbibed Red Bull and true hope is permitted. Whilst we would need a revisit to run new calculations, a "back of the fag packet" view suggests the number beyond 176p would be 201p.
Now for the misery bit. It must be remembered nothing is pointing at this, as the share needs to actually close below 151p to validate these potentials. And even then, miracles have been known to happen!
In the event of closure below 151p, though, the next step down calculates at 125p with secondary, if broken, at 78p. We've circled an area of hope. The current crash perhaps will deem covering the historical gap at 150p as "job done". The 125p level is a bit of a concern as we've three separate calculations pointing at this level as a valid entry point to catch a bounce. Usually, when our software highlights such a thing as a major point of interest, we tend to be resigned to facing reality.
Should Barclays better 178p or droop below 151p, we shall revisit the share, but for now, it's full of potentials without direction...
This article is for information and discussion purposes only and does not form a recommendation to invest or otherwise. The value of an investment may fall. The investments referred to in this article may not be suitable for all investors, and if in doubt, an investor should seek advice from a qualified investment adviser.