Chart of the week: A breakout situation?
16th May 2016 12:54
Update on Schroders
I covered occasionally during its bear phase last year, but now the charts are telling me something interesting may be happening.
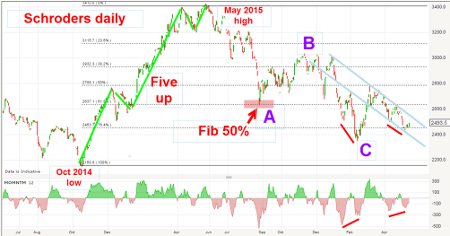
Below is the daily chart from 2014 showing the textbook five impulsive waves up from the October 2014 low, just under £22, to the May 2015 high at £34.
Wave one is a sharp rally, with wave two a classic contracting wedge. I have found that when such a pattern is found in the wave two (or wave four) position, it usually heralds a very sharp move in the same direction as the previous wave.
Remember, waves two and four are counter-trend.
Here is wave two in close-up, showing the beautiful five-wave structure that is typical of a wedge correction:
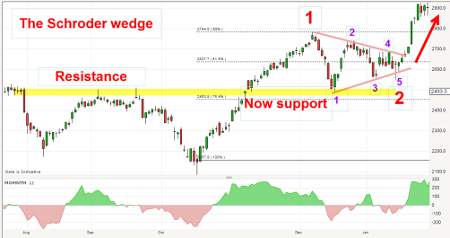
Note that, as wave one progressed, momentum was slowly dropping off, which indicated the rally was running out of steam and at some point selling would dominate - and that occurred in December.
The first move down off the wave one high in purple was sharp, which was normal given the momentum profile (see above), but was contained by the chart support (marked in yellow). That support zone was formed by the July and September highs and is also the Fibonacci 38% retrace of wave one. That combination made the £25 area a strong support zone - and offered a low-risk/high-probability entry.
As the wedge progressed, the waves two to five were getting ever smaller, much as a coiled spring when wound tightly. And we all know what happens when the spring breaks - it unwinds in a most violent fashion!
That is what occurred when the market moved sharply out of the wedge - and when the market moved above the upper wedge line, that was another high probability/low risk entry.
With the fifth wave high put in at the £34 level, the market began a descent which I covered in these pages. But now, with the waves in focus, it appears the decline is a three down A-B-C (to correct the original five-up). Note that wave A turned at the precise hit on the Fibonacci 50% support level.
Recall this was last Summer, when the China scare was rife and stockmarkets across the globe were in freefall. But even in this chaotic state, the Fibonacci levels were beautifully observed. This is a great example of how you can use Fibonacci to unemotionally plan your trades when all others about you are losing their heads. That was another terrific entry opportunity.
Let's fast forward to the current position.
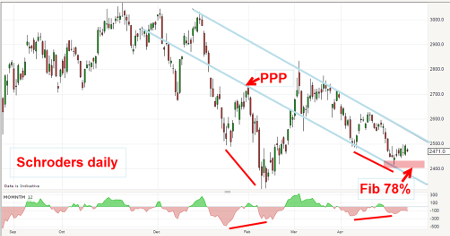
I have a good tramlime pair working with the lower (support) line sporting a solid Prior Pivot Point (PPP), which is a feature I like to see because it gives me added confidence in its ability to continue to support the market.
The key level on the downside is the recent low at £24. This low lies at the Fibonacci 78% support zone which is my last line of support. If that level gives way, odds are good that the market will move to new lows.
The key level on the upside is the upper tramline in the £25.50 area. Breaking above that level with power would confirm the turn and indicate a likely challenge to the £28 high back in March.
Update on Glencore
I last suggested that would reverse its severe bear trend back in October and then again in February, when it was trading in the 70-80p area. Since then, the market has moved up sharply in percentage terms, but does not look too impressive when compared with the savage decline previously.
During this rally phase, sentiment towards commodities and company shares has reversed markedly. As I mentioned last time, a short squeeze was a distinct probability and this is the current situation:
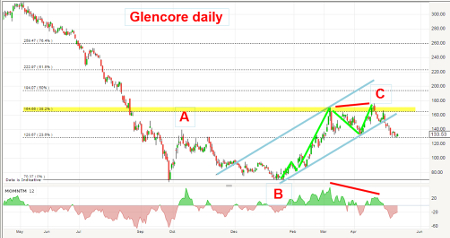
The rally off the February low (my wave B low) is in a clear five sub-waves (marked in green) with the third wave long and strong - a typical characteristic of third waves. Wave four is a typical A-B-C and the fifth wave top was made on a big momentum divergence at the Fibonacci 38% resistance level.
All in all, this was a textbook setup for a big reversal - and a strong hint to take at least some profits off the table above the 160p level.
A long trade from the 90p level would have netted a tidy 80% gain.
I also have a good tramline pair working with the lower line just having been broken - a bearish development. But the market has entered chart support from the wave A high at 130p, where there should be some support.
But, with conflicting trends now in force, a period of consolidation is very likely.
This article is for information and discussion purposes only and does not form a recommendation to invest or otherwise. The value of an investment may fall. The investments referred to in this article may not be suitable for all investors, and if in doubt, an investor should seek advice from a qualified investment adviser.
These articles are provided for information purposes only. Occasionally, an opinion about whether to buy or sell a specific investment may be provided by third parties. The content is not intended to be a personal recommendation to buy or sell any financial instrument or product, or to adopt any investment strategy as it is not provided based on an assessment of your investing knowledge and experience, your financial situation or your investment objectives. The value of your investments, and the income derived from them, may go down as well as up. You may not get back all the money that you invest. The investments referred to in this article may not be suitable for all investors, and if in doubt, an investor should seek advice from a qualified investment adviser.
Full performance can be found on the company or index summary page on the interactive investor website. Simply click on the company's or index name highlighted in the article.
Disclosure
We use a combination of fundamental and technical analysis in forming our view as to the valuation and prospects of an investment. Where relevant we have set out those particular matters we think are important in the above article, but further detail can be found here.
Please note that our article on this investment should not be considered to be a regular publication.
Details of all recommendations issued by ii during the previous 12-month period can be found here.
ii adheres to a strict code of conduct. Contributors may hold shares or have other interests in companies included in these portfolios, which could create a conflict of interests. Contributors intending to write about any financial instruments in which they have an interest are required to disclose such interest to ii and in the article itself. ii will at all times consider whether such interest impairs the objectivity of the recommendation.
In addition, individuals involved in the production of investment articles are subject to a personal account dealing restriction, which prevents them from placing a transaction in the specified instrument(s) for a period before and for five working days after such publication. This is to avoid personal interests conflicting with the interests of the recipients of those investment articles.
Editor's Picks