Chart of the week: A share to double
13th June 2016 13:16
There has rarely been a more reviled company in UK corporate history than , the massive outsourcing operation. Its tentacles stretch into operating prisons, air-traffic centres, train lines and government defence contracts, asylum and immigrant detention centres and so on.
It has been accused of overcharging, including charging for tagging dead people(!) Morale of employees has plumbed new depths. An infamous documentary about the staff abuses in Yarl's Wood immigrant detention centre hit the Channel 4 airwaves.
And just yesterday, a school was reported to have been left with no phone service for three months due to Serco errors.
So, with the shares in freefall and sentiment at rock bottom, is this a classic "buy low, sell high" scenario?
As with any contrarian play, getting your timing right is crucial, but just look at the share history as shown in the monthly chart from 1997:
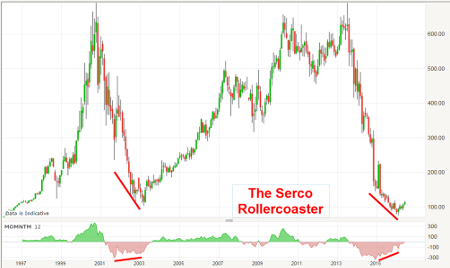
I have named it the Serco rollercoaster for obvious reasons. In the space of 20 years, the shares have moved from sub-100p to a high of around 700p, then back down to 100p in 2003. From there it rallied again, back to the near-700p level, where it peaked again in 2013. And from there, it has been downhill all the way back to the recent sub-100p low.
But note that both times the market has made it back to the 100p area, the reversal has been flagged by the very large momentum divergence (red bars). The question I have is: will history repeat again this time? Will the shares stage another huge rally?
There is a large momentum divergence built into the pattern and the market is moving off the lows, so the setup appears identical.
To get an idea, let's zoom in on the weekly chart:
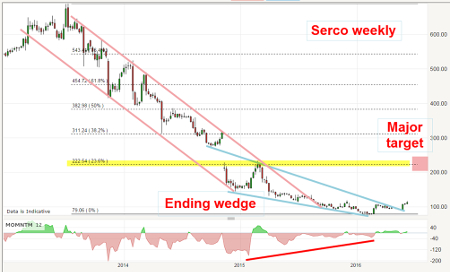
First, the decline off the 2013 high has followed the lovely trading channel contained by my pink tramlines - until the bullish upper tramline break last year.
Second, the decline to the February 76p low was contained in the lovely ending wedge pattern (blue lines) - and the market broke decisively above that wedge on 25 May in an impulsive fashion; that is bullish.
Third, with these bullish signals, the first major target is now at the start of the wedge, which actually coincides with the Fibonacci 23% resistance level and the underside of the huge gap formed in November 2014. That is the 220-240p area.
And here is the daily chart of recent action:
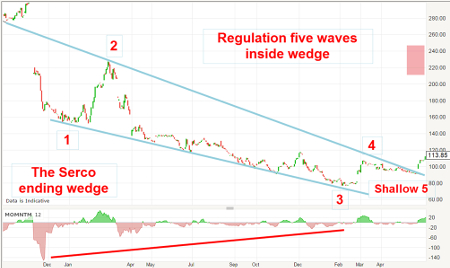
For an ending wedge to be considered genuine, I must be able to count five clear waves inside it - and here they are. The most notable feature is the very shallow wave five. The other feature is that wave three is, as usual, long and strong.
Normally, the fifth wave approaches the lower blue line before reversing, but here buying pressure was just too great for that to occur. This indicates the reversal should be sharp.
Outlook
With this bullish setup, I expect a prompt test of the initial 220-240p target zone. But if the market immediately falls back below the 100p level (on Brexit worries maybe), that would probably indicate a test of the upper blue line at around the 90p area and should set up a kiss and "scalded cat" bounce.
Update on Pearson
On 29 February, I updated and suggested that the share was due a major advance, perhaps towards the 1,000p area, using this chart as my guide:
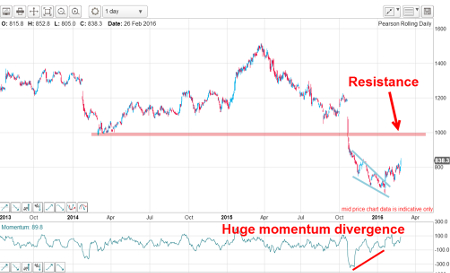
My main target was the line of resistance at around 1,000p. My forecast was based on the A-B-C nature of the decline off the March 2015 high and the ending wedge shown. Here is the updated chart:
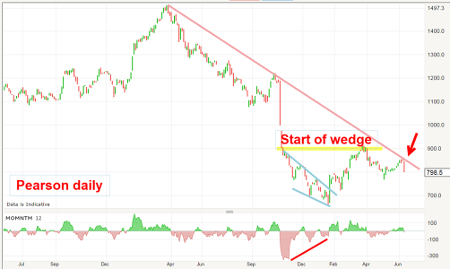
The market did indeed rally as I expected, but did not get very close to my 1,000p target. All it could manage was a rally to the 900p area, which was at the same level as the start of the wedge. Remember, my first target out of a wedge is to the start of it. This is an identical setup to that in Serco above.
But the market did hit my pink downtrend line of resistance last week and is currently bouncing off it.
Here is a close-up of that action:
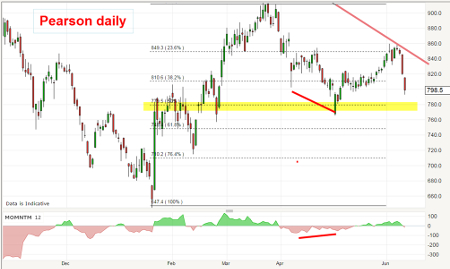
The decline off the 900p level was in a three wave A-B-C form with a nice momentum divergence at the low, and that indicated the uptrend remains intact.
But with last week's decline, the market is currently in limbo as it awaits the 23-24 June 'Brexit' decision.
The decline could carry to the Fibonacci 62% support at around 750p and, if that occurs with a momentum divergence, my bullish stance would be enhanced. But if the market declines below 750p with force, a new test of the low at 650p appears likely.
As 'Brexit' day approaches, UK shares will remain very nervously traded.
This article is for information and discussion purposes only and does not form a recommendation to invest or otherwise. The value of an investment may fall. The investments referred to in this article may not be suitable for all investors, and if in doubt, an investor should seek advice from a qualified investment adviser.
These articles are provided for information purposes only. Occasionally, an opinion about whether to buy or sell a specific investment may be provided by third parties. The content is not intended to be a personal recommendation to buy or sell any financial instrument or product, or to adopt any investment strategy as it is not provided based on an assessment of your investing knowledge and experience, your financial situation or your investment objectives. The value of your investments, and the income derived from them, may go down as well as up. You may not get back all the money that you invest. The investments referred to in this article may not be suitable for all investors, and if in doubt, an investor should seek advice from a qualified investment adviser.
Full performance can be found on the company or index summary page on the interactive investor website. Simply click on the company's or index name highlighted in the article.
Disclosure
We use a combination of fundamental and technical analysis in forming our view as to the valuation and prospects of an investment. Where relevant we have set out those particular matters we think are important in the above article, but further detail can be found here.
Please note that our article on this investment should not be considered to be a regular publication.
Details of all recommendations issued by ii during the previous 12-month period can be found here.
ii adheres to a strict code of conduct. Contributors may hold shares or have other interests in companies included in these portfolios, which could create a conflict of interests. Contributors intending to write about any financial instruments in which they have an interest are required to disclose such interest to ii and in the article itself. ii will at all times consider whether such interest impairs the objectivity of the recommendation.
In addition, individuals involved in the production of investment articles are subject to a personal account dealing restriction, which prevents them from placing a transaction in the specified instrument(s) for a period before and for five working days after such publication. This is to avoid personal interests conflicting with the interests of the recipients of those investment articles.
Editor's Picks