Has Jimmy Choo turned on its heel?
16th August 2016 10:03
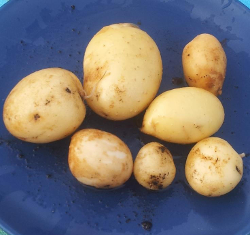
Earlier this year, we presented a slightly dodgy analogy between the need for patience when investing and the need for patience when planting potatoes. As the picture (below right) proves, just one potato has given a seven-fold yield and only needed to be forgotten about for five months. Just like shares, aside from the reasonable growth...
We actually planted around 20 feral potatoes in the garden and it took courage to unearth one - after a visiting deer had eaten the above ground stalks. However, we've proven our investment in a potato paid a pretty reasonable dividend.
This particular topic will never be put to rest, but we can actually make a bit of an argument about share price potentials actually being a real, rather than ridiculous, investment.
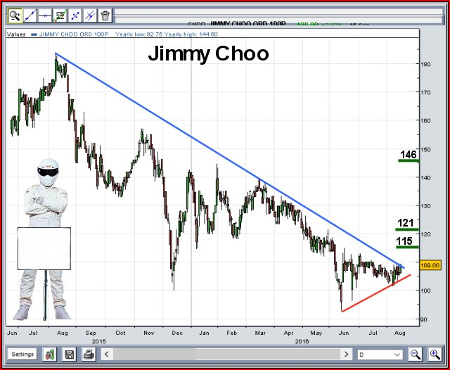
Firstly, the chart has a downtrend since July last year. This trend line is currently 107.684p and, given Choo has now closed at 109p, it can be seen to have broken trend.
This results in the situation where movement now above just 109.5p has an initial hope of 115p with secondary a more useful 121p. We're not convinced the share absolutely requires positive news to make any movement upward, just positive market conditions.
As the chart shows, the price has been pretty flat for the last few months, requiring to fall below 102p to scupper its upward potentials (hint: possible stop loss point - but a bit obvious, so wider preferred).
The "state" of Jimmy Choo is why we developed our trend tool as, sometimes, it can be pretty important to understand the point a share price makes a transit from "going down" to "probably not going down".
Even by 1.5p roughly, closure above a trend is important - and the next thing we're looking for is higher highs. Additionally, while we are in the mood to preach, the secondary target level of 121p looks capable of provoking some stutters.
We can see during May and June, the price flatlined around the 120p level, with the suspicion we're seeing the audition for a glass ceiling. But longer-term, now the price has actually closed above 'blue', we're calculating a distant looking 146p. Once again, judging by movements from 2015 to 2016, we'd suspect stutters can be expected if such a level is achieved.
Finally, a note of caution. Anything capable of forcing the share price below 'red' (102p) risks being nasty, as it moves the price into territory with a possible bottom of 60p or so.
This article is for information and discussion purposes only and does not form a recommendation to invest or otherwise. The value of an investment may fall. The investments referred to in this article may not be suitable for all investors, and if in doubt, an investor should seek advice from a qualified investment adviser.
Alistair Strang has led high-profile and "top secret" software projects since the late 1970s and won the original John Logie Baird Award for inventors and innovators. After the financial crash, he wanted to know "how it worked" with a view to mimicking existing trading formulas and predicting what was coming next. His results speak for themselves as he continually refines the methodology.
Editor's Picks