Chart of the week: What to do with a share that's tripled
12th September 2016 10:28
Has Fresnillo made its high for 2016?
Last week, I restated my query: Has made its high for 2016? Today, I am asking the same question of .
On 18 July, I noted that my target for Fresnillo at £20 had been hit a few days before from my initial buy at the £7 area in February. Because the ascent had been extremely rapid when investors suddenly flocked to the shares as silver 'unexpectedly' rallied, I noted that this presented a great opportunity to take profits off the table.
This was the weekly chart showing my best guess in July:
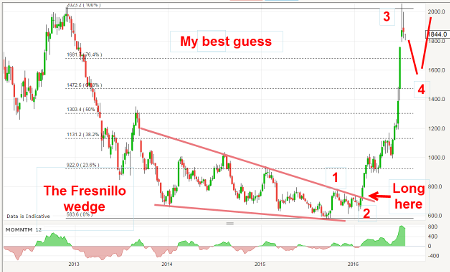
In fact, the bull run was a typical reaction to the multi-year wedge that had formed since 2013 with very clear and accurate ('pink') lines of support and resistance. It is as if the market was acting like a coiled spring winding tighter and tighter until it snapped and all resistance gave way to produce the almost vertical rise.
This chart will surely go down in the annals of chart reading history as a superb example of how a simple observation of the wedge pattern gave all the information needed to extract massive profits in a very short time scale.
No tedious examination of the company accounts was required, nor a detailed study of the supply/demand situation in silver - both of which are always distractions from making good decisions.
Not only that, but a little more chart reading offered me a likely target at the £20 area. So a few minutes spent on the charts gave me the entry, the correct direction and the target for profits. Is there another system or methodology out there that can do all of that with a high degree of accuracy with a few minutes' study? If so, I haven't found it.
Remember, my initial analysis was carried out in the teeth of a huge bearish consensus where the vast majority of market pros were shunning precious metals and the miners.
In the above July chart, I had forecast a dip in wave 4 - but has it occurred? Here is the updated daily chart:

The initial signs are excellent. The decline off the £20 high is in an a-b-c pattern, which is typical in fourth waves. The question is this: has wave 4 found its low and will the market now turn back up?
In the background is the silver price, which suffered a setback late last week as shares in general were hit hard with the Dow losing 400 points on Friday. In recent days, the number of bullish bets on silver by speculators compared with the bearish bets has been running at a record high. This is not a bullish sign.
I have noted before that when speculators amass a lop-sided position either bullish (long futures) or bearish (short futures), a major turn is never far away. That fact has made me dubious of further bullish action - at least near-term. I sense the headwinds against silver and Fresnillo are getting stronger.
So here is an alternative scenario:

To rid the market of the extreme bullish sentiment, the market will need to decline further to one of my targets. A typical retracement is the Fibonacci 62% level which lies at the £12 area. If this occurs and a trader/investor is still holding a full long position, that would be a devastating loss of potential profit. And it may not stop there, of course.
And that little scenario painting is why I always advocate taking at least partial profits off the table as targets are hit - in this case, the decision to do so at £20 in July looks pretty good now, doesn't it?
The financial world is littered with investors who rode a share up the mountain only to see it fall down the other side. Of course, most traders/investors feel more bullish as prices rise. That is perfectly natural. You quietly (or not so quietly) congratulate yourself for being so smart in seeing the opportunity - and acting on it.
And the greater the gains, the more confident you become of further gains. In the case of Fresnillo, you saw the astounding vertical rise - and set your targets higher. But this is a big mistake.
To capture the profit from this scenario, you need to train yourself to become more bearish as prices rise. That way, you do not get carried away in the ecstatic emotions of the herd who have now joined you. Yes, you are now part of the bullish herd - and you probably devour all of the bullish articles that forecast higher prices.
And as we know, when the bulls become too numerous, a major turn down cannot be far away. That is what we are seeing with Fresnillo this month.
I am launching my new VIP PRO SHARE SERVICE later this month which will highlight promising setups for both spread betters and longer-term investors. Details soon.
This article is for information and discussion purposes only and does not form a recommendation to invest or otherwise. The value of an investment may fall. The investments referred to in this article may not be suitable for all investors, and if in doubt, an investor should seek advice from a qualified investment adviser.
These articles are provided for information purposes only. Occasionally, an opinion about whether to buy or sell a specific investment may be provided by third parties. The content is not intended to be a personal recommendation to buy or sell any financial instrument or product, or to adopt any investment strategy as it is not provided based on an assessment of your investing knowledge and experience, your financial situation or your investment objectives. The value of your investments, and the income derived from them, may go down as well as up. You may not get back all the money that you invest. The investments referred to in this article may not be suitable for all investors, and if in doubt, an investor should seek advice from a qualified investment adviser.
Full performance can be found on the company or index summary page on the interactive investor website. Simply click on the company's or index name highlighted in the article.
Disclosure
We use a combination of fundamental and technical analysis in forming our view as to the valuation and prospects of an investment. Where relevant we have set out those particular matters we think are important in the above article, but further detail can be found here.
Please note that our article on this investment should not be considered to be a regular publication.
Details of all recommendations issued by ii during the previous 12-month period can be found here.
ii adheres to a strict code of conduct. Contributors may hold shares or have other interests in companies included in these portfolios, which could create a conflict of interests. Contributors intending to write about any financial instruments in which they have an interest are required to disclose such interest to ii and in the article itself. ii will at all times consider whether such interest impairs the objectivity of the recommendation.
In addition, individuals involved in the production of investment articles are subject to a personal account dealing restriction, which prevents them from placing a transaction in the specified instrument(s) for a period before and for five working days after such publication. This is to avoid personal interests conflicting with the interests of the recipients of those investment articles.
Editor's Picks