Chart of the week: Time to take profits?
19th September 2016 12:07
Has Standard Chartered recovered enough?
I first became interested in this share as the market was plunging to new depths last winter and had appeared to be completing a lovely five-down off the April 2015 highs. In addition, the fifth wave off the wave four high at 800p in November also sported a tell-tale five-down and with a large momentum divergence forming around the 400p level, I believed a large counter-trend rally was in prospect.
After all, the entire banking sector was in free-fall as traders believed the combination of collapsing commodity prices and "lower for longer" interest rates would slam bank's earnings. And at the front of the firing line was with its heavy exposure to Asia where the commodity slowdown was most acute.
But a funny thing happened on the way to a totally bombed-out commodity sector. As Standard Chartered was trading at the 400p level, commodity prices started to rally with gold, silver, copper and even coal prices rebounded sharply. I have covered this story in previous issues.
And that change in sentiment has produced a decent rally in banks - and especially Standard Chartered. In fact, the shares have improved by a lovely Fibonacci 67% off the February low.
If you recall, last winter the talk was of how low commodity prices would fall. And one indicator that was widely quoted was the Baltic Dry Index (BDI), which is a measure of shipping rates of tankers for transporting raw commodities such as iron ore, oil, coal and even grains.
But look at what has happened to this index from the depths of despair in February:
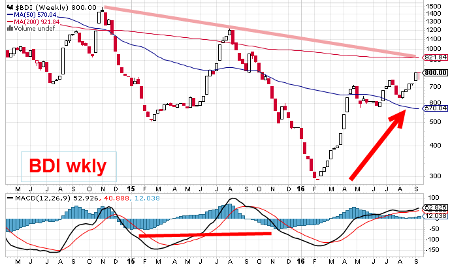
How about that reversal in February? Was anybody watching? I certainly have seen far fewer references in the mainstream media to this index since that time - and perhaps that is a subtle clue that it may well keep on rallying until we see a headline such as "Baltic Dry Index in surprise recovery".
That may spell the rally's end, of course. But that rally has produced a jump in rate from $300/ton to the recent $800/ton - a staggering rise of a Fibonacci 166% (the Golden Mean).
Are you seeing some connection here? I have shown two freely-traded markets that have little obvious direct connection, one in a global bank and the other in a global transportation index. And both have produced rallies off their major winter lows of a Fibonacci multiple. Is that coincidence, or is something else going on?
This was the chart I showed in June:
I noted the excellent blue tramline in operation and the market was bouncing up off the lower one in June. This is what I wrote then: "I also have a lovely blue tramline pair working where the market tested the lower tramline last week on exaggerated Brexit fears that made headlines as FTSE lost umpteen billions in value. Note that Standard Chartered greatly resisted this wobble - and is a clue that the rally now can have considerable legs."
With that uncommon non-reaction to Brexit, I was able to forecast a resumption of the rally to perhaps the meeting of the Fibonacci 38% resistance and my upper blue tramline somewhere in the 700p area.
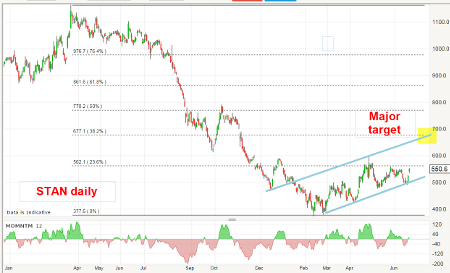
And, since then, the shares have indeed improved and reached a high of 672p on 9 August. Here is the updated daily chart:

Now I have a wedge in formation and the entire rally appears to be in an A-B-C form. It certainly cannot be considered as a five-wave impulsive affair - there are too many overlapping waves. It certainly looks like a bear market rally, so far.
But I needed to see the actual wave development - I could not have made a firm prediction of its shape back last winter.
Remember there is a big difference between three waves and five. A three-wave pattern always indicates the move is a correction to the one larger trend and an A-B-C is always counter-trend. The idea is to position short (or sell longs) when you believe the C wave has exhausted.
A five-wave impulsive pattern, when it appears after a possible trend reversal, is an indication the main trend has really changed. So the rally off the major low in February is not likely to be the start of a major bull run. Of course, the rally could extend higher and my original 700p target could be reached in time, but odds are getting slimmer.
And if the lower blue wedge line is broken with force, odds would be very strong that the main downtrend had taken over.
Most eyes are on Wednesday's Fed decision (or not) on their policy interest rate. My take is that whatever they do (outside of raising rates by more than 1%, or lowering them into deep negative territory) will have little bearing on the main trends now in force.
My VIP PRO SHARES service is now live. For details on my Free Trial offer, please go to my website here.
This article is for information and discussion purposes only and does not form a recommendation to invest or otherwise. The value of an investment may fall. The investments referred to in this article may not be suitable for all investors, and if in doubt, an investor should seek advice from a qualified investment adviser.
These articles are provided for information purposes only. Occasionally, an opinion about whether to buy or sell a specific investment may be provided by third parties. The content is not intended to be a personal recommendation to buy or sell any financial instrument or product, or to adopt any investment strategy as it is not provided based on an assessment of your investing knowledge and experience, your financial situation or your investment objectives. The value of your investments, and the income derived from them, may go down as well as up. You may not get back all the money that you invest. The investments referred to in this article may not be suitable for all investors, and if in doubt, an investor should seek advice from a qualified investment adviser.
Full performance can be found on the company or index summary page on the interactive investor website. Simply click on the company's or index name highlighted in the article.
Disclosure
We use a combination of fundamental and technical analysis in forming our view as to the valuation and prospects of an investment. Where relevant we have set out those particular matters we think are important in the above article, but further detail can be found here.
Please note that our article on this investment should not be considered to be a regular publication.
Details of all recommendations issued by ii during the previous 12-month period can be found here.
ii adheres to a strict code of conduct. Contributors may hold shares or have other interests in companies included in these portfolios, which could create a conflict of interests. Contributors intending to write about any financial instruments in which they have an interest are required to disclose such interest to ii and in the article itself. ii will at all times consider whether such interest impairs the objectivity of the recommendation.
In addition, individuals involved in the production of investment articles are subject to a personal account dealing restriction, which prevents them from placing a transaction in the specified instrument(s) for a period before and for five working days after such publication. This is to avoid personal interests conflicting with the interests of the recipients of those investment articles.
Editor's Picks