Chart of the week: Nearing a market top?
26th September 2016 12:17
by John Burford from interactive investor
Share on
Is Mondi near its top?
is a share I have been covering for some time, with the latest update on April 11. It is a company that is rarely in the media limelight - which is the way many long-term investors like it. It does not attract the "fast money" boys and has produced steady returns over the years.
The company manufactures packaging and paper-based products and its fortunes depend heavily on the state of the global economy and trade volumes. The latter has had a pretty bad press in recent months with many severely negative forecasts appearing in the mainstream media.
And, of course, as I noted this avalanche of bearish commentary, my contrarian antennae started twitching vigorously. And this St Vitus Dance activity led me to the chart of the Baltic Dry Index (BDI) that I showed last week, which showed the BDI is in a strong bull phase - entirely contrary to the gloom-and-doomsters' forecasts of a slowing economy on the edge of disaster.
This was the chart for Mondi I showed in April:
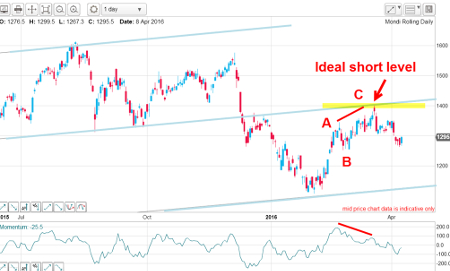
I drew in my blue tramlines which contained the swings very accurately. The centre tramline was particularly useful in highlighting the ideal place to short the shares on the rally off the lower tramline, which was in a classic counter-trend A-B-C pattern with a large momentum divergence going into the C-wave high.
This is always my perfect setup for a very low-risk and high-probability trade! Whenever I see this on almost any chart, I find it difficult not to initiate a trade.
Of course, there is no guarantee the trade will be a big winner at the time. But through my analysis I have placed the odds firmly on my side that the market will very likely back away and at least start a move in my direction. And having a close stop-loss placed just on the other side of the tramline will give me, at worst, only a small loss if I am wrong.
That is the professional approach to trading - and one I encourage all to adopt. Above all, the "secret" of success for both trading and investing is primarily an exercise in risk management.
This is what I wrote back in April:
Provided the 1400p level holds, the bear trend should resume and a test of the lows around 1150p is in prospect. But the decline off the August high has only an A-B-C form so far, and that means a rally above the 1400p level would indicate a more powerful rally phase was in place.
So let's see what the market has done since April:
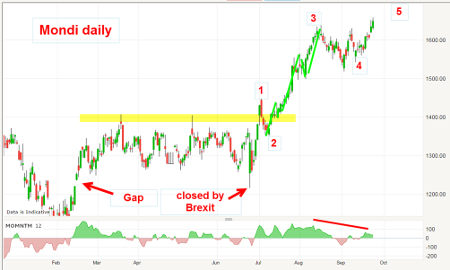
Indeed, the market did decline, but not to the 1,150p area, as I had suggested.
Instead, when the chart gap from February was closed on the Brexit swoon, the shares simply took off and validated my comment that "a rally above the 1400p level would indicate a more powerful rally phase was in place".
After a brief test of the critical 1,400p level, the market marched rapidly northwards to the 1,600p area in August.
Of course, the breach of the 1,400p level was a clear bull signal and, instead of a near-term bearish outlook, the market has told us we had better change our stance to go long around the 1,400p level.
But note the form of the advance off the Brexit low in June. If my Elliott wave labels are correct, we are in the final, fifth wave up of this sequence. And with the momentum divergence forming, a top could occur at any time.
The other big question is this: how does this fit into the really big picture? To gain perspective, I like to go to the multi-year monthly charts - and here is the Mondi monthly:
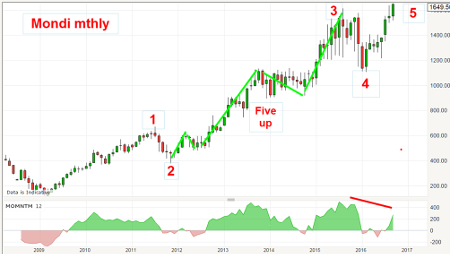
From the 2008 Credit Crunch low, I have a lovely wave one and two and a textbook "long and strong" wave three, which itself contains an excellent five waves up. Then, wave four down ended in February and the top chart shows the advance in the final wave five off that low.
The entire move off the 2009 lows has been one long bull trend in five major waves. In fact, this is a textbook bull market that should be ending soon.
Note the large momentum divergence forming, which is also a warning that a reversal can come at any time.
The bottom line? Mondi shares are in a danger zone for the bulls at the current 1,650p level. I do not have a definite reversal signal yet, but I shall be watching for one.
A reminder that I have launched my VIP PRO SHARES service and have started trading. It is aimed at both spreadbetters and investors alike and I am offering a three-week free trial for you to road-test it. For full details, please go to my website.
This article is for information and discussion purposes only and does not form a recommendation to invest or otherwise. The value of an investment may fall. The investments referred to in this article may not be suitable for all investors, and if in doubt, an investor should seek advice from a qualified investment adviser.
These articles are provided for information purposes only. Occasionally, an opinion about whether to buy or sell a specific investment may be provided by third parties. The content is not intended to be a personal recommendation to buy or sell any financial instrument or product, or to adopt any investment strategy as it is not provided based on an assessment of your investing knowledge and experience, your financial situation or your investment objectives. The value of your investments, and the income derived from them, may go down as well as up. You may not get back all the money that you invest. The investments referred to in this article may not be suitable for all investors, and if in doubt, an investor should seek advice from a qualified investment adviser.
Full performance can be found on the company or index summary page on the interactive investor website. Simply click on the company's or index name highlighted in the article.
Disclosure
We use a combination of fundamental and technical analysis in forming our view as to the valuation and prospects of an investment. Where relevant we have set out those particular matters we think are important in the above article, but further detail can be found here.
Please note that our article on this investment should not be considered to be a regular publication.
Details of all recommendations issued by ii during the previous 12-month period can be found here.
ii adheres to a strict code of conduct. Contributors may hold shares or have other interests in companies included in these portfolios, which could create a conflict of interests. Contributors intending to write about any financial instruments in which they have an interest are required to disclose such interest to ii and in the article itself. ii will at all times consider whether such interest impairs the objectivity of the recommendation.
In addition, individuals involved in the production of investment articles are subject to a personal account dealing restriction, which prevents them from placing a transaction in the specified instrument(s) for a period before and for five working days after such publication. This is to avoid personal interests conflicting with the interests of the recipients of those investment articles.