Three charts flash warning sign for stockmarkets
7th December 2016 11:16
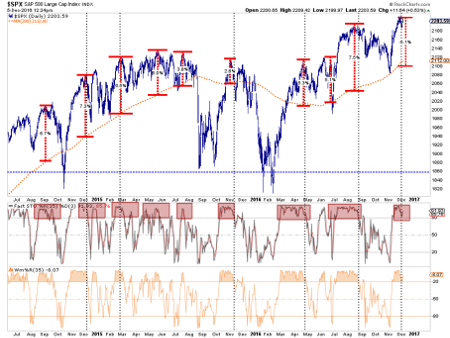
The importance of understanding the nature of reversions is critical for investors. Markets rarely move in one direction for very long, notwithstanding overall trends, without a correction process along the way.
While the chart below shows this clearly for the overall market, it applies to individual sectors of the market as well.
Importantly, notice the bottom two parts of the chart. When there is a simultaneous culmination of overbought conditions combined with a more extreme deviation, corrections usually occur back to the underlying trend.
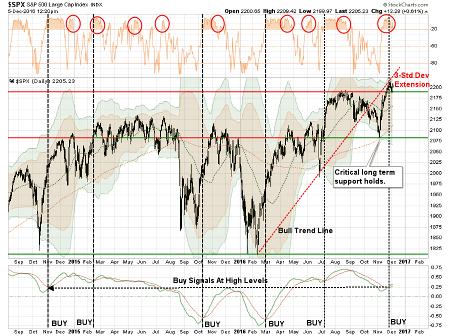
This can be seen in the next chart as well. While the "Trump rally" has pushed asset prices higher and triggered a corresponding "'buy' signal," that signal has been triggered at very high levels combined with a very overbought condition.
Historically, rallies following such a combination have not been extremely fruitful.
Stepping back for just a moment, while the markets continue to ignore the risks of "Brexit", "Trumponomics", "Italexit", rising interest rates, a stronger dollar and valuations in the short-term, history suggests the consequences of excessive risk-taking have not been resolved.
As shown in the very long-term chart below (back to 1925), the markets are pushing long-term overbought conditions, combined with high valuation levels, that have historically yielded low-return outcomes.
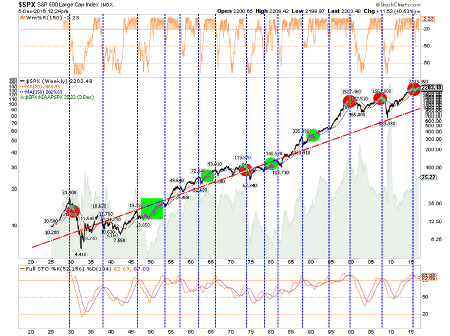
Of course, the timing and the catalysts of a long-term reversion to the mean are unknowable. However, throughout history, they have been repeated with regularity, and ignoring fundamental realities will likely prove to be a bad decision for most.
While asset prices have surged since the election, there is now little room for errors One other interesting tidbit in this regard came from a dear friend of mine over the weekend as we discussed market outlooks and consequences.
When there is extreme bullishness in the equity markets, the ratio of the price of stocks relative to the price of bonds rises to high levels as investors pile into "risk" based assets over "safety". Outcomes, again, have tended not to be good.
The point here is that while asset prices have certainly surged since the election, there is little room for errors in the future.
This article is for information and discussion purposes only and does not form a recommendation to invest or otherwise. The value of an investment may fall. The investments referred to in this article may not be suitable for all investors, and if in doubt, an investor should seek advice from a qualified investment adviser.
Lance Roberts is a Chief Portfolio Strategist/Economist for Clarity Financial. He is also the host of "The Lance Roberts Show" and Chief Editor of the "Real Investment Advice" website and author of The "Real Investment Daily" blog and the "Real Investment Report". Follow Lance on Facebook, Twitter and Linked-In.
Editor's Picks