Can the FTSE 100 reach my 7,600 target?
12th December 2016 11:33
by John Burford from interactive investor
Share on
Now that the shock of the Trump victory is behind us, I thought I would update my outlook for the major UK index. In the space of a month, the has rocketed by almost 500 points.
But that is paltry beside the 2,300 point gain in the Dow Jones! It's true that everything is bigger in the States, isn't it?
Today I will go over my thoughts re: the FTSE since that Trump win back on 8 November - I know many of my readers track the index and even trade it via spread betting. In this way, I can illustrate in a real living case study how I handle risk in my trades. After all, this is the single most important aspect of trading (and investing).
Anyone can buy a traded share or the FTSE index at any time the market is open for business, but the moment you have a position, you are subject to risk of loss. Of course, we all like to focus on the potential gain that our informed and authoritative research has uncovered. That is natural.
I have found that few analyse the risk before placing their trade nor have any strategy of handling the ever-changing potential for loss as the share price movements unfold.
The most basic risk management tool is the stop-loss, of course, which is placed a distance away from the trade entry. I consider it foolish to trade without a stop, but the bad news is that I have yet to discover a fool-proof system that gives a "correct" distance for the stop from entry. It is still rather a hit-and-miss art.
But this little example will give some idea how I correct for this slight drawback.
Here is the one-hour chart I showed in my previous coverage of the FTSE 100 on 14 November, only six days after the US elections:
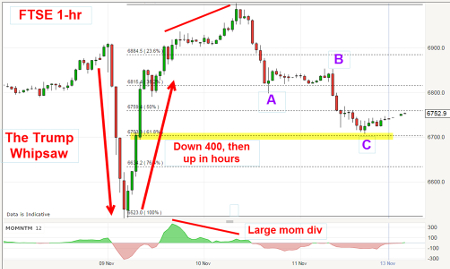
I noted the "Trump whipsaw", with the market down 400 pips and then up again in rapid succession. It then moved to a new high, but on a large momentum divergence that signalled a steep corrective decline.
That decline appeared right on cue and, on 12 November, the market had traced out an A-B-C, which is the signature of a correction.
The C wave had also hit the Fibonacci 62% support level, which is a typical turning point where the rally phase resumes. But there was no momentum divergence between the A and C waves - a warning that this may not be the final low.
But that was enough information to enter a 'buy' order. Before I do, however, I need to evaluate the maximum risk I will allow. Because the Fib 62% level is usually strong support, a stop just below it at 6,990 is appropriate.
If the worst case occurs, I will be stopped out for a manageable loss and the market may dip to the next Fib level at around 6,630 - where the Fib 78% sits, and where I may be looking at a new long entry, depending on the setup (do not prejudge!)
So my 'buy' order was filled at the 6,730 level with a stop at 6,990 for a maximum loss of 40 points.
Following my entry, the market rose gently and this is the updated chart:
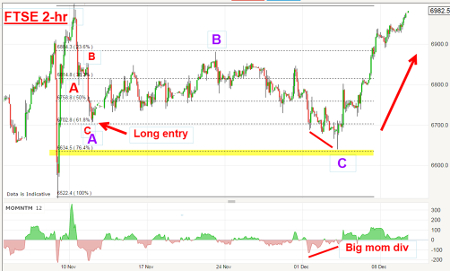
My original A-B-C is on the left and my long entry is shown. Over the course of the next few days, the market was in a shallow rising pattern (which was a clue that a sharp rally was unlikely just yet).
The maximum price reached was my purple B wave high at around 6,880 - 150 points above my entry.
Now this is where it gets interesting - and an important lesson for risk control. Because the gain there was 150/40 (3.75) times my initial risk, I could invoke my "break even rule" and raise my stop to the same level as my entry at 6,730.
And, when the decline resumed on 21 November, the market passed through my stop and took me out - but for a zero-loss round trip. My account balance was not impacted one iota.
I have my long-standing head and shoulders (H&S) measured target at 7,300Now I was able to take a fresh look at a new possible turning point - and that candidate was the lower Fib 78% level (yellow bar).
And, on 4 December, the market briefly touched that 6,640 level, so, with the larger purple A-B-C pattern in place and a large momentum divergence, I opened another long trade at the 6,700 level using the spike low at 6,640 as my stop level.
As of Friday, the market is up 280 points from entry and my stop was never in danger. I can now raise it to break-even for now and take a look at raising it even higher to protect profits.
That is the disciplined way of trading any market and I recommend it to anyone.
Finally, here are my long-term targets - here is the monthly chart:
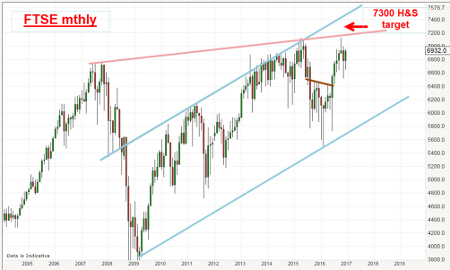
My blue tramlines are drawn from the 2009 lows and the upper tramline is a reliable line of resistance, since it has a prior pivot point and multiple accurate touch points (as well as one impressive pigtail in 2013). If the FTSE 100 can reach that tramline, my target is in the 7,600 area.
Below that, I have my long-standing head and shoulders (H&S) measured target at 7,300.
And below that, my pink trendline has a target at the 7,200 area. This is a very solid multi-year line of resistance and breaking above that would be a majestic show of strength. If that occurs, it should be off to the races to the 7,600 area.
But first, I need to see a test of the 7,200 level.
Flash update: Overnight, with the explosive rally in energies, FTSE reached a high of 7,070 - only 130 points from my first target.
This article is for information and discussion purposes only and does not form a recommendation to invest or otherwise. The value of an investment may fall. The investments referred to in this article may not be suitable for all investors, and if in doubt, an investor should seek advice from a qualified investment adviser.
These articles are provided for information purposes only. Occasionally, an opinion about whether to buy or sell a specific investment may be provided by third parties. The content is not intended to be a personal recommendation to buy or sell any financial instrument or product, or to adopt any investment strategy as it is not provided based on an assessment of your investing knowledge and experience, your financial situation or your investment objectives. The value of your investments, and the income derived from them, may go down as well as up. You may not get back all the money that you invest. The investments referred to in this article may not be suitable for all investors, and if in doubt, an investor should seek advice from a qualified investment adviser.
Full performance can be found on the company or index summary page on the interactive investor website. Simply click on the company's or index name highlighted in the article.
Disclosure
We use a combination of fundamental and technical analysis in forming our view as to the valuation and prospects of an investment. Where relevant we have set out those particular matters we think are important in the above article, but further detail can be found here.
Please note that our article on this investment should not be considered to be a regular publication.
Details of all recommendations issued by ii during the previous 12-month period can be found here.
ii adheres to a strict code of conduct. Contributors may hold shares or have other interests in companies included in these portfolios, which could create a conflict of interests. Contributors intending to write about any financial instruments in which they have an interest are required to disclose such interest to ii and in the article itself. ii will at all times consider whether such interest impairs the objectivity of the recommendation.
In addition, individuals involved in the production of investment articles are subject to a personal account dealing restriction, which prevents them from placing a transaction in the specified instrument(s) for a period before and for five working days after such publication. This is to avoid personal interests conflicting with the interests of the recipients of those investment articles.