Chart of the week: New target for this stock
3rd January 2017 11:36
by John Burford from interactive investor
Share on
What do I see for 2017?
At this time of the year, it is customary to offer forecasts for the year ahead. This is a dangerous game because, as the wise man said: "Forecasting is tough - particularly if it is about the future".
Professional pundits often get it spectacularly wrong, but they still seem to keep their well-paid jobs in a supreme example of the current almost-universal phenomenon of rewards for failure. Unfortunately, independent traders like you and me are definitely not rewarded for our failures. If we get it wrong, we lose money.
I have come to the conclusion that trading the public financial markets must be one of the toughest careers on earth. As a former rocket scientist - I was a scientist at NASA for a few years - I believe it is even tougher than that. We are always dealing with scenarios involving major uncertainties in all time frames all of the time.
We often read the comment that "traders/investors/businesses hate uncertainty", as if there is total certainty at any time. There isn't. As in horse racing, there are no dead certs. All we can do is play the odds.
I am a fan of old black-and-white movies, and how many times do I read that so many films that were made on a shoestring under difficult chaotic conditions became today's well-loved classics, against the odds. Out of chaos can come order, a theme that applies in spades to the markets.
That is why I adhere to the Elliott wave model of sentiment swings because it describes best why markets make the moves they do - and crucially can often forecast with high accuracy the road-map for the future.
Last year, I showed numerous examples of this ability at work in real time in many FTSE 100 shares. For that is the supreme test of any reliable theory of market forecasting: does it work fairly consistently in practice over time. And, combined with the Fibonacci principles and my own Tramline system, I have devised a handy and simple method of market analysis and forecasting. However, it cannot be applied to every situation! There are some charts that are beyond analysis by my methods. That is when I move to more amenable setups.
But, at any time, I can find enough markets that can be analysed to keep me busy.
Of course, any tool is only as good as the expertise of the person using it. Give a highly sophisticated piece of engineering in the form of a Formula 1 racing car to a teenager and the results will usually be less than winning.
Incidentally, I am not overly concerned which company share gives me my profit - a chart is a chart is a chart. Many investors fall in love with one company or another (they buy the 'story') and avoid others. As a trader, I look at everything because most share charts display similar wave patterns and if I recognise a particular pattern in one, I zoom in on that. The name is of little importance.
Here is an example of a share I have not yet covered for COTW - .
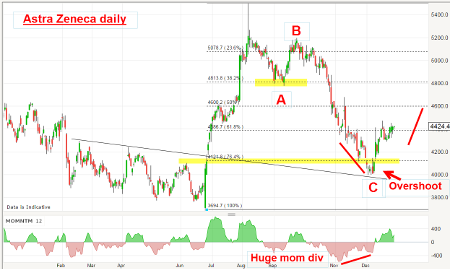
Big Pharma has had a torrid time since last summer and, while under some dark clouds, the ANZ share price fell hard from £54 to a low of £40 in December. But one glance at the chart told me the decline was likely to reverse.
Why was that? Simply because the decline is in a textbook A-B-C three waves down and three complete waves is always corrective - that is, the decline is a correction to the main trend, which is up.
Also, there was a slight overshoot of the 'last chance' Fibonacci 78% support level, but there was an accompanying large momentum divergence which told me that the selling pressure was rapidly drying up. Odds for a trend reversal at the £40 area were getting much stronger.
By my reckoning, the downside risk was limited but the upside potential much greater. This was going to be a textbook contrary trade because, even if the trade did not work, I was following my trading rules with discipline and I could set a tight protective stop. That is all a trader can humanly do.
This morning, the shares have duly advanced off the support early last month to the £44 area - a gain of 10%. And, if the budding rally can continue, I have a target set at the £48 area.
This article is for information and discussion purposes only and does not form a recommendation to invest or otherwise. The value of an investment may fall. The investments referred to in this article may not be suitable for all investors, and if in doubt, an investor should seek advice from a qualified investment adviser.
These articles are provided for information purposes only. Occasionally, an opinion about whether to buy or sell a specific investment may be provided by third parties. The content is not intended to be a personal recommendation to buy or sell any financial instrument or product, or to adopt any investment strategy as it is not provided based on an assessment of your investing knowledge and experience, your financial situation or your investment objectives. The value of your investments, and the income derived from them, may go down as well as up. You may not get back all the money that you invest. The investments referred to in this article may not be suitable for all investors, and if in doubt, an investor should seek advice from a qualified investment adviser.
Full performance can be found on the company or index summary page on the interactive investor website. Simply click on the company's or index name highlighted in the article.
Disclosure
We use a combination of fundamental and technical analysis in forming our view as to the valuation and prospects of an investment. Where relevant we have set out those particular matters we think are important in the above article, but further detail can be found here.
Please note that our article on this investment should not be considered to be a regular publication.
Details of all recommendations issued by ii during the previous 12-month period can be found here.
ii adheres to a strict code of conduct. Contributors may hold shares or have other interests in companies included in these portfolios, which could create a conflict of interests. Contributors intending to write about any financial instruments in which they have an interest are required to disclose such interest to ii and in the article itself. ii will at all times consider whether such interest impairs the objectivity of the recommendation.
In addition, individuals involved in the production of investment articles are subject to a personal account dealing restriction, which prevents them from placing a transaction in the specified instrument(s) for a period before and for five working days after such publication. This is to avoid personal interests conflicting with the interests of the recipients of those investment articles.