Chart of the week: Is BT really a bargain?
30th January 2017 10:14
by John Burford from interactive investor
Share on
Were you ready for BT's 20% plunge?
grabbed the headlines last week - for all the wrong reasons. On Tuesday morning, shares opened with a huge gap down of about 20% on revelations of the Italian subsidiary's accounting scandal (a common occurrence in that country, which is a surprise to some, apparently).
But, for many, this was a severe over-reaction to what in reality concerned a very small part of BT's global empire. The Italian business accounts for only £100 million in earnings out of an annual total of £7.6 billion (0.13%). The 20% plunge wiped a massive £8 billion off the common shares value - one year's worth of earnings.
But, as we know, share prices are not derived from logical analysis of the underlying fundamentals. They are driven by changes in sentiment - and sentiment towards BT had been falling for some time. This latest episode was just one more push on the downslope that had started last February. So Tuesday's plunge should not have been totally unexpected.
Here is the long-term monthly chart showing the bull market that started at the depths of the Credit Crunch episode in 2009, when the shares were trading at less than a pound:
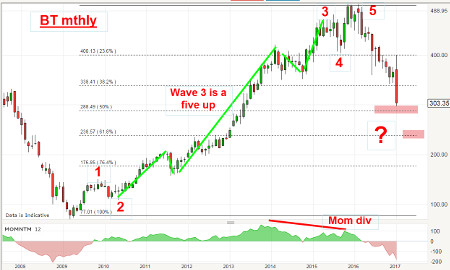
The most striking feature, at least for an Elliott technician, is the textbook five-wave structure to the February 2016 high at the £5 level.
The third wave is also textbook in that it is long and strong and contains its own five waves up. Note that maximum bullish momentum occurred not at the top of the third wave, but some way along it. This is entirely typical of impulsive waves and demonstrates that, even with weakening relative buying power, the market can still maintain its bullish momentum.
But, finally, the upward trend runs out of steam as the buying power is not enough to keep the share price aloft and the sellers take over in wave 4. But because sentiment has not turned negative enough to start a bear trend, the market rallies to new highs in wave 5, but on reduced buying power. That sets up the momentum divergence between waves 3 and 5, which is very common.
In a sense, the market 'knows' that the third wave is not the final upward push and there has to be one more. I have commented before on the fact that markets have memories (otherwise, why would straight lines of support and resistance exist on the charts in the form of tramlines?).
But with the completion of the necessary five waves up to the February high at £5 last year, the market has been correcting downwards. The share price remained at or near the £5 level for many weeks - surely enough time for investors to take profits with due deliberation?
But how many did so? Because the vast majority of investors (not so much traders) ignore the basic rule of Buy Low, Sell High, my guess is that many more private investors were buying at the high rather than selling. It is the power of herding.
And here is the daily chart showing the decline last year off the £5 high
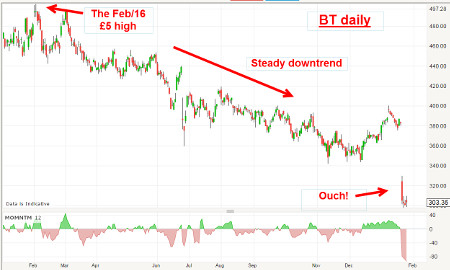
The downtrend is pretty relentless - and confirms precisely the bearish forecast told by the Elliott wave count in the top chart. And note that BT shares have been trending firmly down while the FTSE 100 index has generally been in bullish mode.
This is always a worry for investors. A share that cannot pick itself up and flies against the general trend is usually an excellent candidate for ditching and/or shorting - and employ the capital in more promising issues.
The Tuesday gap certainly stands out! It is massive - and highlights the tremendous damage done to the chart - and investor sentiment.
But does this present a bargain-basement chance to pick up a stalwart of the FTSE 100?
We have all heard of the admonition: Don’t try to catch a falling knife! But BT is a solid company, not some penny mining share whose only asset is a hole in the ground and a lot of hype and hope.
Going back to the monthly chart, the shares are close to the Fibonacci 50% support level around the £2.85 area and this is a region that normally represents solid support.
Of course, if general market conditions suddenly turn more bearish, the shares could fall to the Fibonacci 62% support level at around £2.35 from where I expect a rally to develop if that occurred.
But for potential buyers, the gap represents a magnet that prices will eventually be attracted to. The question is: how deep will the correction be before any rally emerges that could fill the gap?
Of course, the ideal position for a trader or investor is to have taken profits last year. As poker players say, you've got to know when to hold 'em and when to fold 'em. Then, reinvest elsewhere and put BT on your list of possible buys. But long-term holding the shares on the run up to £5 and now on the downslope to £3 was not the ideal strategy.
And that is why I am most definitely not a 'buy and hold' man. I rest my case.
Read more about John and his successful Tramline Trading strategy here
This article is for information and discussion purposes only and does not form a recommendation to invest or otherwise. The value of an investment may fall. The investments referred to in this article may not be suitable for all investors, and if in doubt, an investor should seek advice from a qualified investment adviser.
These articles are provided for information purposes only. Occasionally, an opinion about whether to buy or sell a specific investment may be provided by third parties. The content is not intended to be a personal recommendation to buy or sell any financial instrument or product, or to adopt any investment strategy as it is not provided based on an assessment of your investing knowledge and experience, your financial situation or your investment objectives. The value of your investments, and the income derived from them, may go down as well as up. You may not get back all the money that you invest. The investments referred to in this article may not be suitable for all investors, and if in doubt, an investor should seek advice from a qualified investment adviser.
Full performance can be found on the company or index summary page on the interactive investor website. Simply click on the company's or index name highlighted in the article.
Disclosure
We use a combination of fundamental and technical analysis in forming our view as to the valuation and prospects of an investment. Where relevant we have set out those particular matters we think are important in the above article, but further detail can be found here.
Please note that our article on this investment should not be considered to be a regular publication.
Details of all recommendations issued by ii during the previous 12-month period can be found here.
ii adheres to a strict code of conduct. Contributors may hold shares or have other interests in companies included in these portfolios, which could create a conflict of interests. Contributors intending to write about any financial instruments in which they have an interest are required to disclose such interest to ii and in the article itself. ii will at all times consider whether such interest impairs the objectivity of the recommendation.
In addition, individuals involved in the production of investment articles are subject to a personal account dealing restriction, which prevents them from placing a transaction in the specified instrument(s) for a period before and for five working days after such publication. This is to avoid personal interests conflicting with the interests of the recipients of those investment articles.