Chart of the week: Favourite share sends warning
27th February 2017 13:02
by John Burford from interactive investor
Share on
A lesson in trading from Sage
has been one of my favourite shares and now the chart pattern could be sending a warning that what happened to this share could also take place in the general market as measured by the FTSE 100. It is time to heed the lessons that SAGE has been sending us.
The last time I covered it was on 5 December, but before that I had noted that the chart was a classic powerful bull market where corrections to the uptrend were barely registered. In fact, for many years it was a veritable widows and orphans holding.
But its weak performance since last summer may be a clue as to what will befall the general market later this year. Along with the FTSE 100 index, many shares are likewise currently in a very strong uptrend. At some stage, this trend will turn - and the example of SAGE may provide a salutary lesson.
To recap the SAGE story: it had risen from the 150p post-2009 low to the 700p area by August. But the most remarkable feature was that the share price had gone exponential as vividly shown by the monthly chart which I published in December;
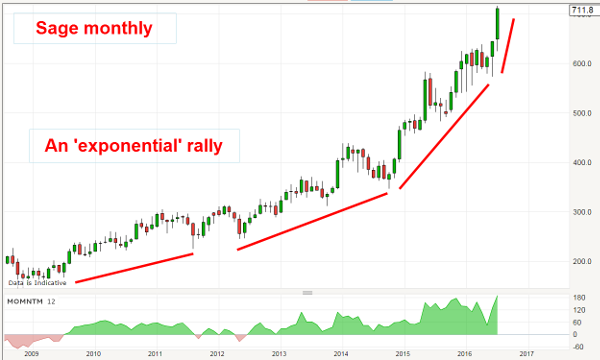
The slope of the uptrend had gradually steepened to a point where the acceleration was out of control. It was only a matter of time before the rocket would run out of fuel and start falling to earth. That is what happens to all such rockets.
Of course, most traders understand that and some will start selling their holdings or even start shorting the shares. But without a technical method for pinpointing a suitable place to do this, many traders act on a whim. But, as I mentioned recently, gut feel is no trading plan.
The shares did move up a little further into September and then traced out a lovely topping pattern where I could draw a minor support line (shown in pink):
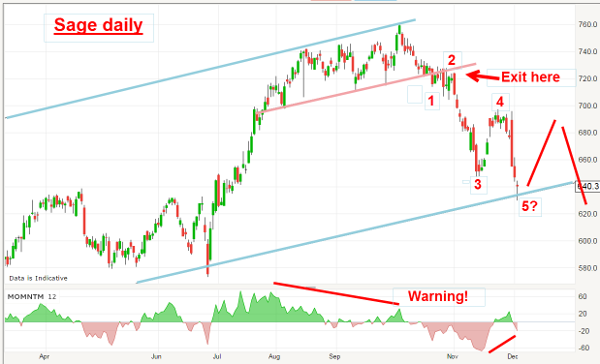
This pink line contains at least five accurate touch points so that a downward break of it would very likely spell the end of the bull trend. That was a sensible place to set sell orders (at around the 720p level).
And, right on cue, the shares did take a big tumble on that break with the result shown in the above chart which was taken in December.
Of course, it is always useful to evaluate some likely downside targets in case you wish to take some profits on your shorts if you are a short-term swing trader. I had placed my Elliott wave labels on the above chart and reckoned the market was in wave 5 of a major leg down.
This is what I wrote in December: "Now the shares are on a major support line and there is a momentum divergence between the third and fifth waves. Normally, this would indicate a decent rally lies ahead, but we do not know for sure that the support will hold - this fifth wave may have further to travel."
From the shape of the waves to that point, I was able to approximate the likely extent of the immediate bounce off my tentative wave 5 low - and that is shown by the red bars on the above chart. I reckoned the maximum upside would be in the 680-690p area before turning down again.
And that was a highly accurate prediction - here is the updated daily chart:
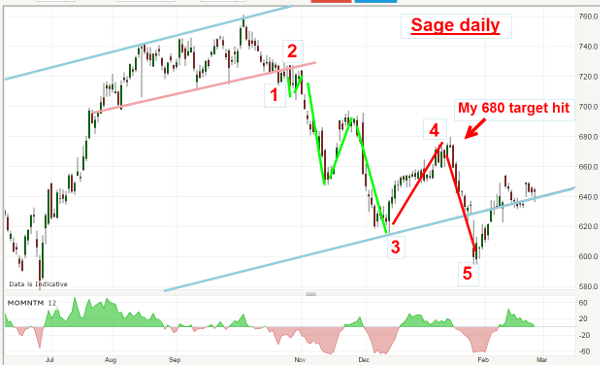
In January the market did indeed rally and made it to the 680p level on the button. The market then turned hard down to plunge below my lower tramline support. Now that action caused me to slightly amend my wave labels to those shown.
And that is another lesson in trading. We are always dealing with possible wave labels and tramline placements in real time, and these could be amended in the light of subsequent market action. This is a good example. I have also slightly modified my blue tramline placements for the same reason.
So, in January, the market was in its final fifth wave. Where was it likely to turn back up? That is where my Fibonacci levels come into their own again. I noted that 600p was the Fibonacci 38% level of the large rally off the major low in early 2015 - and that was a great candidate for the wave 5 low. Shorts could be covered there, of course.
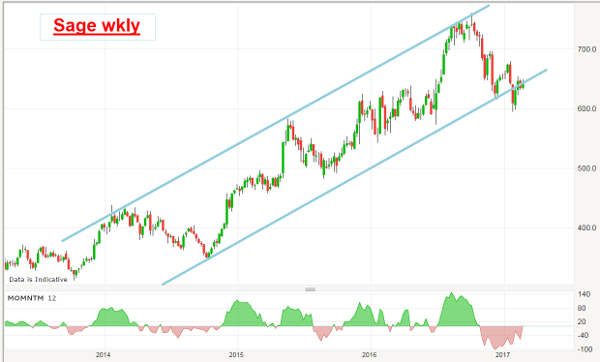
Now that the market has recovered from the Fib 38% support, it is now testing the support/resistance of the lower tramline. Here is the weekly:
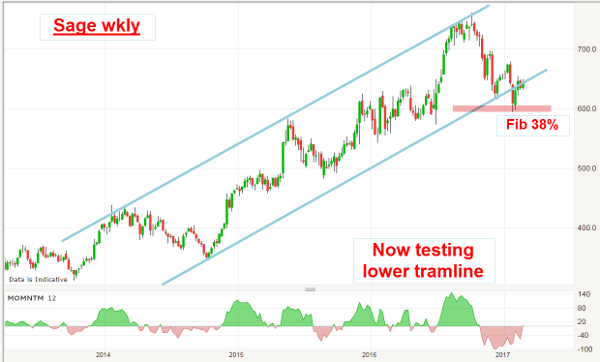
But, with the clear tramline break, a lot of damage has been done to the bull trend. With this now two-way market scenario, I expect the shares to remain range-bound for some time - and there may be better opportunities elsewhere.
At the least, shorts taken at the 720p level can now be protected by moving stops to that entry price.
From a solidly bullish outlook last summer, the market suddenly turned down and gave a classic sell signal at 720p. Now, the shares could be poised for another leg down. And could this action be mirrored In the FTSE a little later on this year?
This article is for information and discussion purposes only and does not form a recommendation to invest or otherwise. The value of an investment may fall. The investments referred to in this article may not be suitable for all investors, and if in doubt, an investor should seek advice from a qualified investment adviser.
These articles are provided for information purposes only. Occasionally, an opinion about whether to buy or sell a specific investment may be provided by third parties. The content is not intended to be a personal recommendation to buy or sell any financial instrument or product, or to adopt any investment strategy as it is not provided based on an assessment of your investing knowledge and experience, your financial situation or your investment objectives. The value of your investments, and the income derived from them, may go down as well as up. You may not get back all the money that you invest. The investments referred to in this article may not be suitable for all investors, and if in doubt, an investor should seek advice from a qualified investment adviser.
Full performance can be found on the company or index summary page on the interactive investor website. Simply click on the company's or index name highlighted in the article.
Disclosure
We use a combination of fundamental and technical analysis in forming our view as to the valuation and prospects of an investment. Where relevant we have set out those particular matters we think are important in the above article, but further detail can be found here.
Please note that our article on this investment should not be considered to be a regular publication.
Details of all recommendations issued by ii during the previous 12-month period can be found here.
ii adheres to a strict code of conduct. Contributors may hold shares or have other interests in companies included in these portfolios, which could create a conflict of interests. Contributors intending to write about any financial instruments in which they have an interest are required to disclose such interest to ii and in the article itself. ii will at all times consider whether such interest impairs the objectivity of the recommendation.
In addition, individuals involved in the production of investment articles are subject to a personal account dealing restriction, which prevents them from placing a transaction in the specified instrument(s) for a period before and for five working days after such publication. This is to avoid personal interests conflicting with the interests of the recipients of those investment articles.