Chart of the week: It’s doubled but this share could go higher
6th March 2017 12:21
by John Burford from interactive investor
Share on
Rio Tinto pauses for breath
Since late 2015 when I first assumed a bullish stance on base metals and the big miners, has moved up very sharply from the £16 lows to the recent £36 region. Back in late 2015, there were few who saw the upside potential – most were convinced the massive oversupply of metals, combined with the China slowdown and weak steel prices, would perpetuate the bear trends that were in force from 2011.
But, of course, no trend lasts forever, and my job as a technical analyst is to pinpoint trend changes. Most people do not even attempt this very difficult task. Why do I say it is a tough job? For one thing, have you ever tried to catch a falling knife?
For another, most hedge funds are trend-followers simply because to be otherwise is to go against your peers – and that puts your career in severe jeopardy. If you get it wrong and - even if correct but your timing is out – you stand out like a sore thumb, and no trader working in a highly competitive organisation risks that, if they wish to keep their job.
How much safer to go with the crowd in a trend! And that is one reason we see hedge fund herding in action. They all buy into the same story.
But the end result of this herding is that the vast majority of speculators are on the wrong side when the trend changes. This applies in spades to the money managers.
And recognising this herding phenomenon is extremely useful in pinpointing trend changes. If you can get on board a new trend very early, you have the potential to make a lot more profit than if you had joined half-way along.
The other important point is that when early in a new uptrend, the moves in your direction are often swift as the 'wrong' short bets that the majority hold are covered on the way up.
That means your position is usually always in profit – a great benefit of course. If you join a trend part of the way along, you stand a real chance of the market going against you for a period before resuming the trend (if it ever does). For most of us, that is a difficult period where our emotions become heavily involved (to put it mildly!).
Also, if you are not skilled in finding trend changes, how will you be able to take optimum profits when the trend does reverse?
In a nutshell, that is why I have honed my analytical skills to seek out major trend changes early in their development. I rest my case.
My last coverage was 21 November, and this was the chart then:
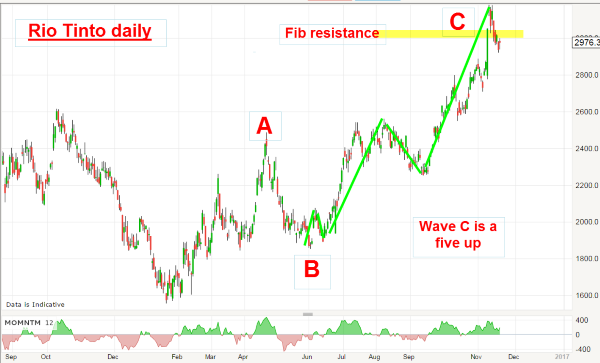
The rally off the February low looked to me like an A-B-C, which has a three-wave form and three waves always indicate a correction to the main trend. That is a central tenet of the Elliott wave model. If this were the correct count, I would expect the market to resume falling. But that was only one of two likely outcomes!
The other possibility back then was that the rally could be counted as waves 1, 2 and 3 of what would turn out to be a five-up, not a three. And the outlook for that option is a very different one. It implies a much stronger rally phase ahead, taking the shares beyond the Fibonacci resistance at the £30 region.
Because I judged it a 50/50 proposition, I offered the suggestion in November to take some profits off the table at the £30 area for a very decent gain. Of course, we traders come with a wide variety of risk profiles. Some more cavalier traders may have ignored that idea, while more conservative traders would have grabbed the chance to bank some profit. It's horses for courses.
As it happened, the market did power ahead beyond the Fib resistance and this is the current weekly chart:
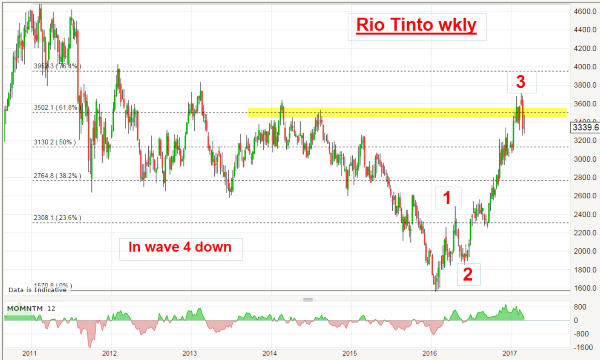
The rally carried to the £36 level a week or so ago, which is the Fib 62% resistance level – a typical point where trends either pause or turn back. And that was another place where some profits could be taken.
But what stands out is the nature of my wave 3 (not a wave C as I suspected in November) – it is long and strong, which is a requirement for a third wave. Last week, the market has nudged down in what should be wave 4. When this wave ends, I am looking for another move up in the final wave 5, taking the shares above the £36 high.
And, if this forecast does not pan out, at least we have taken some excellent profits on the way up – and can start to look for other opportunities.
Free trial offer for my VIP PRO SHARES service
You have seen how I make successful trades here in my Chart of the Week columns, while cutting the losers. Perhaps you wished you had caught some of these tremendous moves. Well, I have some great news - now you can!
Sign up to this free three-week trial of my VIP PRO SHARES membership service, exclusive to Chart of the Week readers, and I'll email you my trades as I make them in real time!
Apply here now
John Burford is a freelance contributor and not a direct employee of Interactive Investor. All corre-spondence is with John Burford who, for these purposes, is deemed a third-party supplier. Buying, selling and investing in shares is not without risk. Market and company movement will affect your performance and you may get back less than you invest. Neither John Burford, Shareprice, or In-teractive Investor will be responsible for any losses that may be incurred as a result of following a trading idea.
These articles are provided for information purposes only. Occasionally, an opinion about whether to buy or sell a specific investment may be provided by third parties. The content is not intended to be a personal recommendation to buy or sell any financial instrument or product, or to adopt any investment strategy as it is not provided based on an assessment of your investing knowledge and experience, your financial situation or your investment objectives. The value of your investments, and the income derived from them, may go down as well as up. You may not get back all the money that you invest. The investments referred to in this article may not be suitable for all investors, and if in doubt, an investor should seek advice from a qualified investment adviser.
Full performance can be found on the company or index summary page on the interactive investor website. Simply click on the company's or index name highlighted in the article.
Disclosure
We use a combination of fundamental and technical analysis in forming our view as to the valuation and prospects of an investment. Where relevant we have set out those particular matters we think are important in the above article, but further detail can be found here.
Please note that our article on this investment should not be considered to be a regular publication.
Details of all recommendations issued by ii during the previous 12-month period can be found here.
ii adheres to a strict code of conduct. Contributors may hold shares or have other interests in companies included in these portfolios, which could create a conflict of interests. Contributors intending to write about any financial instruments in which they have an interest are required to disclose such interest to ii and in the article itself. ii will at all times consider whether such interest impairs the objectivity of the recommendation.
In addition, individuals involved in the production of investment articles are subject to a personal account dealing restriction, which prevents them from placing a transaction in the specified instrument(s) for a period before and for five working days after such publication. This is to avoid personal interests conflicting with the interests of the recipients of those investment articles.