Chart of the week: A big money trade
13th March 2017 12:25
by John Burford from interactive investor
Share on
AstraZeneca hits my target
As a leading big pharma company, its shares have been swinging over a wide range in the past few years as is typical for risk-taking companies – and that is the kind I like!
There are many FTSE 100 shares that trade over modest annual ranges (such as the utilities) and so they present slimmer pickings for spread betters than the 'racier' issues. In general, I much prefer to trade this latter category.
I covered on 3 January at the start of the new year and noted the very juicy setup in the chart. Here is that January chart:
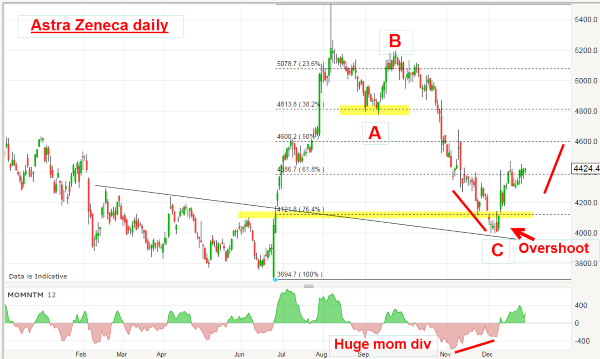
The initial reaction to the June Brexit vote was to sell. But, in common with many other issues, that attracted huge buy orders and the market shot high above the trendline. A buy stop placed just above that line in the £41 area would have been well rewarded.
But with news of drug test failures hitting the headlines in the winter, the shares were hit hard and, by late December, had fallen from the post-Brexit euphoria high above £54 to a low of £40.
However, as I wrote in January, "But one glance at the chart told me the decline was likely to reverse.
"Why was that? Simply because the decline is in a textbook A-B-C three waves down and three complete waves is always corrective (that is, the decline is a correction to the main trend, which is up).
"Also, there was a slight overshoot of the 'last chance' Fibonacci 78% support level but there was an accompanying large momentum divergence which told me that the selling pressure was rapidly drying up. Odds for a trend reversal at the 40 area were getting much stronger."
And there was another potentially bullish factor at play - if I extended the minor trendline from the March-July period into the future, I could count on that line being a line of support. It is well-known that lines of support/resistance can remain operative well into the future.
As a great example, here is the weekly chart of that shows a lovely 3½-year trendline, which is a line of resistance
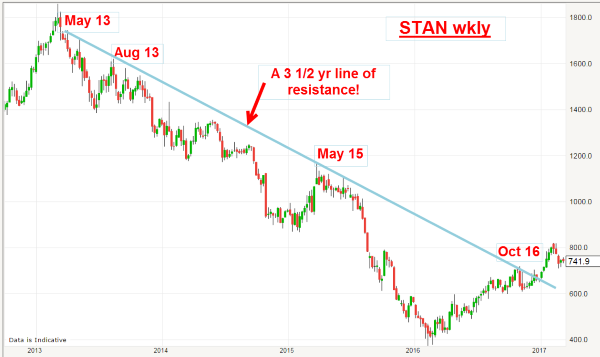
Note that all of the touch points are very accurate. The question is this: How does the market 'know' that 3½ years later, it 'should' back off the precise moment it hits the line from underneath? (Answer: Because markets have memories).
After I legitimately drew the line from the May 2015 touch point and extended it 16 months into the future, it still behaved as a line of resistance. That is, until that resistance was broken in December – and that was a buy signal.
A digital straight edge was all I needed to forecast the October 2015 bounce! No fancy (and expensive) robots or algos required.
Going back to the AZN chart, when the market dipped to the £40 level in December, it tested the support line which gave the market added support at that level. Going long at around £40 was a low-risk play. So what was a likely target to aim for?
This is what I wrote in January: "This morning, the shares have duly advanced off the support early last month to the 44 area – a gain of 10%. And if the budding rally can continue, I have a target set at the 48 area."
My target was £48 and that would be a decent profit from the £40 (or £44) area.
Here is the latest daily chart:
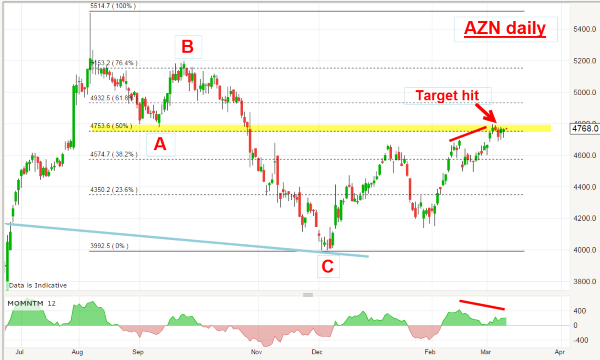
Bingo! Target hit last week and profits taken. Now I can move onto the next setup.
Free trial offer for my VIP PRO SHARES service
You have seen how I make successful trades here in my Chart of the Week columns, while cutting the losers. Perhaps you wished you had caught some of these tremendous moves. Well, I have some great news - now you can!
Sign up to this free three-week trial of my VIP PRO SHARES membership service, exclusive to Chart of the Week readers, and I'll email you my trades as I make them in real time!
Apply here now
John Burford is a freelance contributor and not a direct employee of Interactive Investor. All corre-spondence is with John Burford who, for these purposes, is deemed a third-party supplier. Buying, selling and investing in shares is not without risk. Market and company movement will affect your performance and you may get back less than you invest. Neither John Burford, Shareprice, or In-teractive Investor will be responsible for any losses that may be incurred as a result of following a trading idea.
This article is for information and discussion purposes only and does not form a recommendation to invest or otherwise. The value of an investment may fall. The investments referred to in this article may not be suitable for all investors, and if in doubt, an investor should seek advice from a qualified investment adviser.
These articles are provided for information purposes only. Occasionally, an opinion about whether to buy or sell a specific investment may be provided by third parties. The content is not intended to be a personal recommendation to buy or sell any financial instrument or product, or to adopt any investment strategy as it is not provided based on an assessment of your investing knowledge and experience, your financial situation or your investment objectives. The value of your investments, and the income derived from them, may go down as well as up. You may not get back all the money that you invest. The investments referred to in this article may not be suitable for all investors, and if in doubt, an investor should seek advice from a qualified investment adviser.
Full performance can be found on the company or index summary page on the interactive investor website. Simply click on the company's or index name highlighted in the article.
Disclosure
We use a combination of fundamental and technical analysis in forming our view as to the valuation and prospects of an investment. Where relevant we have set out those particular matters we think are important in the above article, but further detail can be found here.
Please note that our article on this investment should not be considered to be a regular publication.
Details of all recommendations issued by ii during the previous 12-month period can be found here.
ii adheres to a strict code of conduct. Contributors may hold shares or have other interests in companies included in these portfolios, which could create a conflict of interests. Contributors intending to write about any financial instruments in which they have an interest are required to disclose such interest to ii and in the article itself. ii will at all times consider whether such interest impairs the objectivity of the recommendation.
In addition, individuals involved in the production of investment articles are subject to a personal account dealing restriction, which prevents them from placing a transaction in the specified instrument(s) for a period before and for five working days after such publication. This is to avoid personal interests conflicting with the interests of the recipients of those investment articles.