How you could have predicted FTSE 100 rally to 7,400
10th May 2017 17:49
by Lee Wild from interactive investor
Share on
Some call it a dark art, like reading tea leaves, or that its followers must be members of the Mystic Meg fan club (there is one, I've checked). However, even dyed-in-the-wool disciples of fundamentals cannot ignore the importance, or usefulness, of charts or technical analysis.
This is not where I argue in favour of the practice, but rather where I use movement in today's market as a clear example of how it can work in its simplest form, and how even novice investors can use basic charting tools to their benefit.
Our resident chartist Alistair Strang has developed his own incredibly accurate software to predict where markets might go, and which levels might prove significant.
There are very good reasons why particular price points are relevant – after a profits warning, shareholders often decide they'll sell if they ever see pre-warning prices again.
But as Alistair is fond of telling us, there are lots of like-minded people drawing pretty lines on bits of paper in dealing rooms and living rooms all over. That adds a crucial self-fulfilling element to chart-reading which any investor can take advantage of.
Take the FTSE 100.
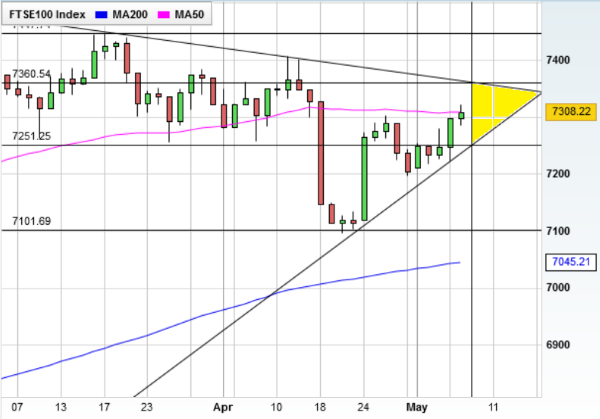
On Tuesday I published an article FTSE 250 has 20,000 in sight. Scroll down and there's a FTSE 100 chart with a wedge pattern clearly marked. I'd printed it out the day before, and it has been sitting on my desk staring at me ever since (see below).

Multiple touch points on both the downtrend line from the March high at 7,447, and the uptrend from last month's 11-week low, validate the pattern – the more touch points the better, but you'd like at least three.
And the key price points here are blindingly obvious from a visual perspective. It really was just a matter of time before a breakout of some kind occurred. And when they come, they are often dramatic.
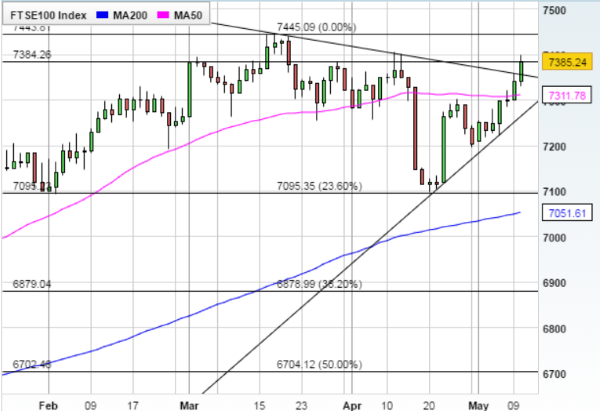
Today, the line indicated a move above 7,360 might be the breakout. It was, and between late morning and the daily high the FTSE 100 added 38 points to nudge 7,400 for the first time in a month. That's a bullish indicator.

And it's also worth mentioning Fibonacci retracement. Most charting packages include a Fibonacci tool (including Interactive Investor), which investors can draw between a significant peak or trough on any share price chart they are analysing.
You’ll see Fibonacci ratios of 23.6%, 38.2%, 50%, 61.8% and 100%, which often act as key levels of support or resistance. Before discarding Fibs as mumbo-jumbo, try it.
While I’m not for one moment suggesting investors trade without doing some serious fundamental analysis, they should use every weapon in their armoury, and charts can and do give a valuable steer on possible share price behaviour.
And, in a further demonstration of the power of charting, Alistair's analysis on Monday has proved typically prescient. He wrote:
"The FTSE indeed called our bluff, closing Friday at 7,297 and creating a scenario where movement now better than this closing price introduces the market to a region where 7,385 becomes possible, perhaps even 7,480 in the fullness of time.
"For the next few days, our 7,385 ambition will prove capable of regaining the Brexit vote uptrend, something which generally proves to be a "good thing" as strong and stable growth will often follow thereafter."
Where did the FTSE 100 close today? 7,385. Spooky.
This article is for information and discussion purposes only and does not form a recommendation to invest or otherwise. The value of an investment may fall. The investments referred to in this article may not be suitable for all investors, and if in doubt, an investor should seek advice from a qualified investment adviser.