Charting the way back for Laura Ashley
20th June 2017 09:31
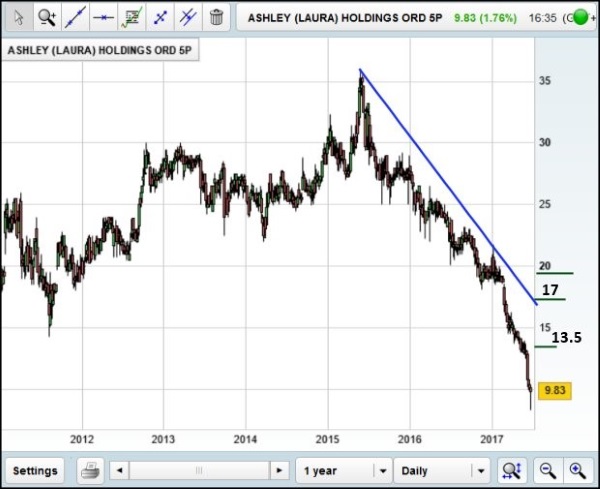
Laura Ashley & the euro (LSE:ALY & GBP:EUR)
Our last review of (link here) suggested 9p as an "ultimate bottom", one of these things where often a share shall experience a proper bounce as we cannot calculate below.
Of course, sometimes this attitude can go horribly wrong with a "flushing toilet" sound effect.
We're not going to dwell on the prospects below 9p as prefacing drop targets with minus signs tends be a little silly.
Instead, prospects improve if the price now betters 12.5p, then we'll look for coming growth toward 13.5p – let's face it, useless - but secondary, if 13.5p is bettered, calculates at a longer term 17p.
This is where it starts to become slightly interesting as it tends to suggest a challenge against the 'blue' line, the ruling downtrend since 2015.
In the (unfortunately unlikely currently) event of the share actually closing above this blue line, we'll need to revisit and brew another set of tea leaves.
GBP:EUR
We recently started covering a Forex pair (the UK pound v the US dollar), and already we're starting experience reservations, as we tend to regard Forex as rigged against private traders unless they're blessed with pockets bigger than Mrs May's ability to misjudge stuff.
We were far from impressed with the GBP:USD pairing making a fake movement upward prior to a drop, this being the nonsense we constantly warn against.
With GBP:EUR, the current situation feels like the pairing is about to relax toward €1.10 next, perhaps even €1.07 if the wrong politician says the wrong thing in the wrong place. To shatter this scenario, the relationship needs strengthen above €1.18.
In plain English, if intending to hedge against an expensive holiday in Europe, it'd probably make some sense to exchange some chocolate UK coins for the European variety now just in case it all goes wrong suddenly.
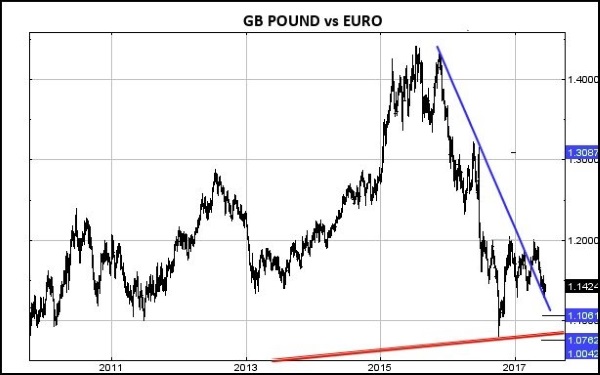
Of course, the bigger problem remains of parity looking viable unless some miracle gets this group above €1.18 and, of course, there's always the red line on the chart from 2008, currently at €1.094, which will doubtless be used to enable a fake near-term bounce if attacked.
There's a funny fly in the ointment, one which frankly puzzles, and it's shown in blue on the chart.
Basically, this downtrend appears to be valid, something we'd really not expected given the pairings prior behaviour.
Visually, there appears little doubt the market thinks it important and this often can prove useful. If this blue line breaks, currently €1.124, then a drop to €1.1 is liable to be rather sharp and, frankly, we'd not be aghast if any drop immediately challenged 'red'.

Alistair Strang has led high-profile and "top secret" software projects since the late 1970s and won the original John Logie Baird Award for inventors and innovators. After the financial crash, he wanted to know "how it worked" with a view to mimicking existing trading formulas and predicting what was coming next. His results speak for themselves as he continually refines the methodology.
Alistair Strang is a freelance contributor and not a direct employee of Interactive Investor. All correspondence is with Alistair Strang, who for these purposes is deemed a third-party supplier. Buying, selling and investing in shares is not without risk. Market and company movement will affect your performance and you may get back less than you invest. Neither Alistair Strang, Shareprice, or Interactive Investor will be responsible for any losses that may be incurred as a result of following a trading idea.
This article is for information and discussion purposes only and does not form a recommendation to invest or otherwise. The value of an investment may fall. The investments referred to in this article may not be suitable for all investors, and if in doubt, an investor should seek advice from a qualified investment adviser.
Editor's Picks