The 'utterly crucial' number for Barclays shares
22nd June 2017 09:48
Barclays (LSE:BARC)
Following our grumble last month about ridiculous share price shuffle, it appears our maxim, "if it ain't goin' up, it's goin' down", has again proven correct.
This piece of silliness, applied when a share has ticked all boxes for a rise (but doesn't), increasingly seems one of the more valuable lessons about trend theory. It isn't the trend which is important but how a price reacts to it.
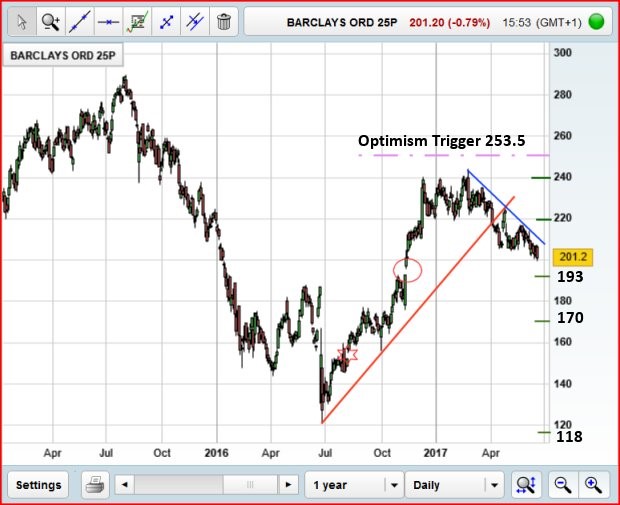
The immediate situation with Barclays is fairly simple. Movement in 2017 tells us we dare not trust any rise until such time the share price betters 253.5p. In such a scenario, we'd be justified in feeling comfortable some real movement is coming.
Until then, we're left with little choice but to try and identify where a bottom shall appear on the current price cycle. When we review dance steps during June, the suggestion now is of weakness below 199p provoking 196p, maybe even 193p.
While all these numbers are in the same zone, there's a fairly massive problem should the price devalue below 193p as the tea leaves spell out 170p as the next point with bounce potential.
In some ways, this is a fairly useful logic given it permits a long position in the 190s with a stop emplaced just below 193p if attempting to cherry pick a bounce.
Absurdl,y though, our worry about 193p actually proving to be a bottom is shown with the red circle. The price suffered a manipulation gap at 193p.
The next time the market reverses a share to bounce precisely at the point of manipulation will be - probably - the first time. While a bunch of folk will doubtless "jump in", thinking the gap is covered and Barclays will limbo no lower, we're showing 23p worth of clear air between 193p and 170p.
Tending to favour the 170p level as being endowed with trampoline juice was the cluster of moves during Aug/Sep 2016. It's amazing how often these 'sticky points' in a price's movement table tend prove fascinating for share prices.
It'd prove daft to ignore this shambles of proposals taking Barclays share price pretty firmly below the immediate uptrend. Additionally, we suspect it'd prove an error to focus on the "star" manipulation gap at 152p as we've a really major problem should 170p break.
The "absolutely must bounce" point south of such calculates at 118p. This number is obviously a load of tosh - aside from the obvious low of 2016 already being present on this naughty step.
Of course, the foregoing is an exercise of trying to find logic for this share to actually bounce, but it feels like we're providing negative Lasagne. Layer upon layer of bad stuff.
An attempt to escape the immediate downtrend looks fairly easy to spot.
Barclays need only better the blue ilne on the chart, currently 210p, to greatly reduce our justification for grief, as it feels like any bounce bettering this level should continue to 220p initially. Secondary comes in at 240p if the prior price is bettered.
Visually this isn't great as it 'just' promises a stutter when a rise matches the prior highs on the chart. This is why our 253.5p criteria is so utterly crucial for the longer-term future. Only if above dare we believe Barclays is getting high.
This article is for information and discussion purposes only and does not form a recommendation to invest or otherwise. The value of an investment may fall. The investments referred to in this article may not be suitable for all investors, and if in doubt, an investor should seek advice from a qualified investment adviser.
Editor's Picks