Chart of the Week: Take profits on this bank before the market turns
28th July 2017 09:48
by John Burford from interactive investor
Share on
Standard Chartered nearing end of relief rally
has taken a battering in recent years. I last covered it on 22 May when I entitled the article: 'STAN is riding my waves' and I could just as well use the same title today.
In fact, my wave analysis in May was spot-on - and demonstrates how, by using only basic Elliott wave theory, you can stay well ahead of the crowd and produce forecasts that are remarkably accurate.
In May I showed this long-term chart:
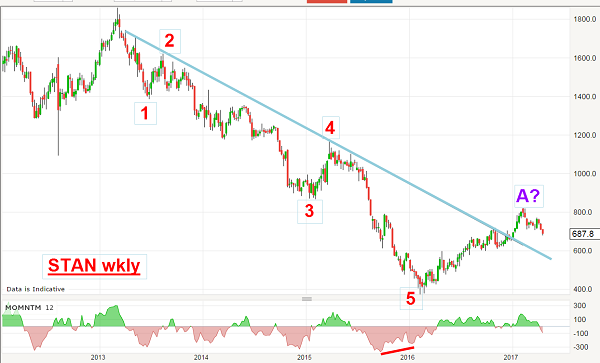
The terrible bear market of 2013 to 2016 - taking the share price from £18 to a low of £3.70 in early 2016 - produced a massive loss of value of a staggering 80%. Now, this is (or is that 'was'?) a "widows and orphans" holding - a major bank, no less - and acted more like a pump-and-dump tech start-up on AIM!
But the form of the decline is a textbook five impulsive wave. Wave 3 is the typical long and strong wave and wave 5 contains its own internal five-wave pattern. And when the market moved below the £4 level, I noted a building momentum divergence (red bar) where the selling pressure was drying up as prices declined.
That is one of the tell-tale signs of an imminent trend change in the fifth wave - and so it proved. The market then started a relief rally and in May had broken above the major blue trendline in wave A of what I believed should be an A-B-C rally.
This three-wave form is the standard response to a major five-wave trend. With this knowledge, I could make a firm forecast that when wave A ended, there would be a turn down in wave B and then a move back up in wave C, which would normally end above the high of wave A.
So in May, this was my tentative forecast on the daily chart:
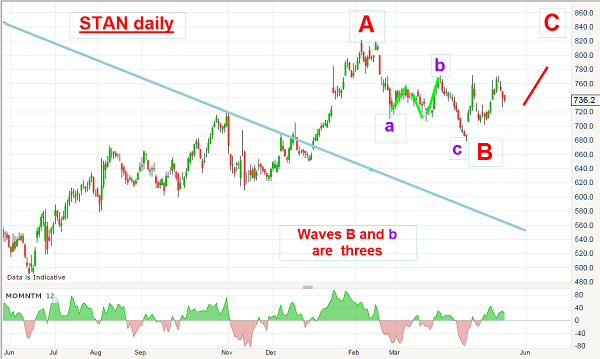
The move off the A wave high was in three (purple) waves and that meant wave B may have ended at the £6.80 level and the market was taking off in wave C.
Was this forecast correct? Here is the daily chart updated:
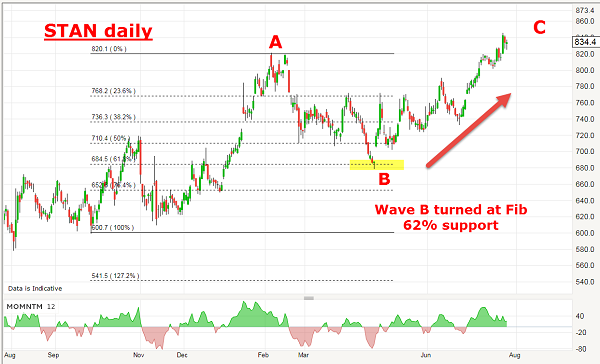
I was right - wave B did complete and make a turn right at the Fibonacci 62% support level at £6.80, which was a textbook area to take a long trade at low risk.
Now, with the market moving sharply higher, it has moved above the A wave high, as forecast. Isn't that pretty?
So now, having fulfilled the forecast, the market can turn down at any time. Remember, this is a relief rally in an ongoing bear market and the rule here is: never over-stay your welcome! When the market turns down, it can turn viciously. My strategy in these situations is to take partial profits when a target has been reached (as here) and keep raising stops on the remainder as the market moves up.
In the unlikely event the shares will scream higher, I have banked a profit and have an open position gaining ground until my stop takes me out. That is the professional approach and I recommend it to everyone.
These articles are provided for information purposes only. Occasionally, an opinion about whether to buy or sell a specific investment may be provided by third parties. The content is not intended to be a personal recommendation to buy or sell any financial instrument or product, or to adopt any investment strategy as it is not provided based on an assessment of your investing knowledge and experience, your financial situation or your investment objectives. The value of your investments, and the income derived from them, may go down as well as up. You may not get back all the money that you invest. The investments referred to in this article may not be suitable for all investors, and if in doubt, an investor should seek advice from a qualified investment adviser.
Full performance can be found on the company or index summary page on the interactive investor website. Simply click on the company's or index name highlighted in the article.
Disclosure
We use a combination of fundamental and technical analysis in forming our view as to the valuation and prospects of an investment. Where relevant we have set out those particular matters we think are important in the above article, but further detail can be found here.
Please note that our article on this investment should not be considered to be a regular publication.
Details of all recommendations issued by ii during the previous 12-month period can be found here.
ii adheres to a strict code of conduct. Contributors may hold shares or have other interests in companies included in these portfolios, which could create a conflict of interests. Contributors intending to write about any financial instruments in which they have an interest are required to disclose such interest to ii and in the article itself. ii will at all times consider whether such interest impairs the objectivity of the recommendation.
In addition, individuals involved in the production of investment articles are subject to a personal account dealing restriction, which prevents them from placing a transaction in the specified instrument(s) for a period before and for five working days after such publication. This is to avoid personal interests conflicting with the interests of the recipients of those investment articles.