Chart of the Week: The real reason the FTSE 100's heading south
14th August 2017 11:28
Is the FTSE 100 breaking down?
Since I returned to the world of trading after spending many years running a few real businesses (including being a greetings card publisher!), I decided to try to find a methodology that could help explain how market turns could be understood - and, more importantly, how to predict where they might occur in the future. After all, what investor/trader doesn’t want to know where markets will make major highs and lows?
I am pleased to say my road to enlightenment has been advanced considerably by working with Elliott waves and the idea that the wave patterns - and market highs and lows - are determined in advance to certain degrees of probability. No longer do I see waves on a price chart as just random events determined by the news.
Of course, no way of seeing the markets and making forecasts can be 100% accurate. But if you can make enough great calls in a year based on your method - and keep losses on the losers small - you will rank in the top 5%. The key is to stay with your winning trades as far as possible and to exit at an opportune time. And that is no easy task.
Knowing when to cash in on a great trade is never easy - it is the hardest part of trading/investing. Of course, most investors take the easy route and hold their investments either forever (and bequeath them to their successors), or cash out when they have fallen a long way (at the worst possible time) or when they need the cash.
I believe that traders who have a solid method and follow it with discipline deserve all their hard-won gains. Their profits are certainly not "unearned income". They are truly professionals in the best sense.
So, with insights provided by Elliott Wave Theory and my understanding of basic chart patterns such as trendlines, triangles, support/resistance zones and so on, I have two strings to my bow. The third is my tramline concepts.
So many pundits make forecasts based only on their personal feelings that this or that will happen with no evident underlying analytical basis. Yes, I realise most readers want an exciting story they can believe in that augments their own views, but this approach can lead you very much astray.
For instance, with the index in a solid bull run, many are projecting a continuation of the trend. After all, that is the laziest position to take. But, using my methods, I believe the immediate trend has likely turned - and here is my reasoning (and it has nothing to do with North Korea!).
This is the daily chart:
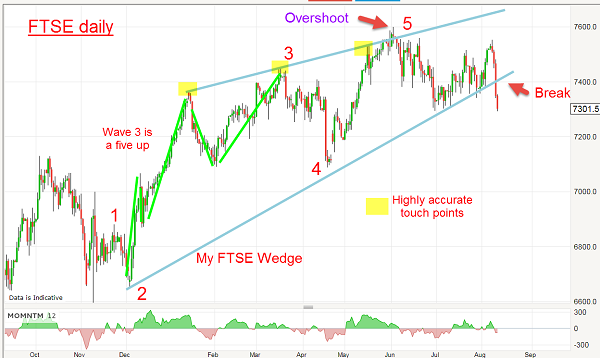
From the Trump election low of below 6,800 in November, I have a complete five waves up to the 2 June high at the precise 7,600 print inside a magnificent wedge pattern. This is a well-known up-sloping pattern where the highs line up along the upper line of resistance and the lows line up along its line of support.
When this wedge formation (also called an ending diagonal) appears after a lengthy bull (or bear) run, it usually signals the trend is about to turn down. But what makes this an especially powerful reversal signal is the brief overshoot above the upper line and a smart pull-back under it. An overshoot can be thought of as a buying exhaustion.
So, when that overshoot occurred in early June, I was highly alerted to a move down into June. That duly appeared and helped confirm the reversal. But I was not quite ready to place maximum shorts - I need to see a little more chart action.
When the market hit the lower wedge line in early July and bounced back up, what I wanted was a three-wave pattern in the rally because three waves are always counter-trend and would add even more confirmation of the new downtrend. And I was not disappointed. Here is a close up of the action:
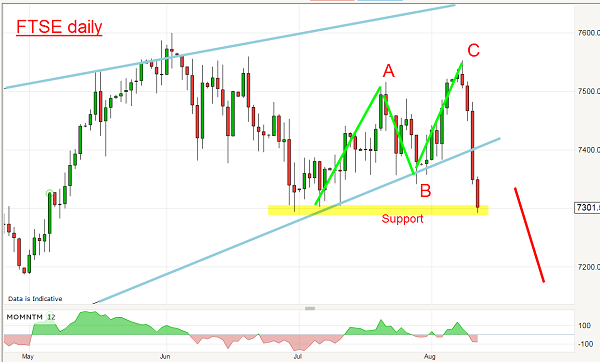
This A-B-C is about as textbook as you will find in the FTSE 100. When the C wave was put in (on a Fibonacci 78% retrace), the way was clear for a resumption of the downtrend and the market closed hard down last week into Friday’s close and broke below the lower wedge line on Thursday.
With all the above clues, I can state with some confidence that the trend is now down and it would take an unlikely move above the C wave high at 7,550 to change my mind. Of course, we could see a small bounce towards the lower line in a typical kiss, but that should be about it. But a kiss miss would suggest big declines immediately ahead.
Forget North Korea - just trade the patterns. They hold the key to market action.
These articles are provided for information purposes only. Occasionally, an opinion about whether to buy or sell a specific investment may be provided by third parties. The content is not intended to be a personal recommendation to buy or sell any financial instrument or product, or to adopt any investment strategy as it is not provided based on an assessment of your investing knowledge and experience, your financial situation or your investment objectives. The value of your investments, and the income derived from them, may go down as well as up. You may not get back all the money that you invest. The investments referred to in this article may not be suitable for all investors, and if in doubt, an investor should seek advice from a qualified investment adviser.
Full performance can be found on the company or index summary page on the interactive investor website. Simply click on the company's or index name highlighted in the article.
Disclosure
We use a combination of fundamental and technical analysis in forming our view as to the valuation and prospects of an investment. Where relevant we have set out those particular matters we think are important in the above article, but further detail can be found here.
Please note that our article on this investment should not be considered to be a regular publication.
Details of all recommendations issued by ii during the previous 12-month period can be found here.
ii adheres to a strict code of conduct. Contributors may hold shares or have other interests in companies included in these portfolios, which could create a conflict of interests. Contributors intending to write about any financial instruments in which they have an interest are required to disclose such interest to ii and in the article itself. ii will at all times consider whether such interest impairs the objectivity of the recommendation.
In addition, individuals involved in the production of investment articles are subject to a personal account dealing restriction, which prevents them from placing a transaction in the specified instrument(s) for a period before and for five working days after such publication. This is to avoid personal interests conflicting with the interests of the recipients of those investment articles.
Editor's Picks