Chart of the week: A low-risk mid-cap trade
4th September 2017 11:39
by John Burford from interactive investor
Share on
Capita - is it a capital trade here?
Whatever you may think of operating business model (especially regarding its employees' pension changes and treatment of unpaid interns), the shares have been a dream to trade since 2015 - but only if trading from the short side. On the other hand, investors have been beaten black and blue as the shares have collapsed from the £13 level in 2015 to the £4.30 December low.
But with the shares appearing in many lists of the 'best shares to avoid', is it worth looking at the opposite side of that negative stance for a trading turn?
Here is the weekly chart going back to the glory days of 2015-2016. It shows the bull run into the July 2015 highs:
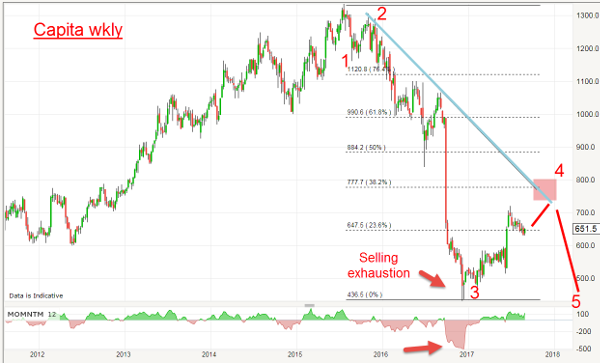
But it was all downhill from there - and with the plunge low of December last year, I can venture the most likely wave labels. Waves 1 and 2 are entirely normal and wave 3 is a very 'long and strong' affair which culminated in the December selling exhaustion.
Note that there was only one decent relief rally all the way along wave 3 - and that highlights why I prefer trading third waves. They are relentless in the direction of travel but trading them is like trying to hold onto a tiger by its tail - exciting but very dangerous.
So, for this year, the shares have been in a relief rally off that spectacular wave 3 low in a fourth wave. We know that fourth waves are usually in threes (or variations) so that form is what I will be looking for. Let's zoom in on the daily chart:
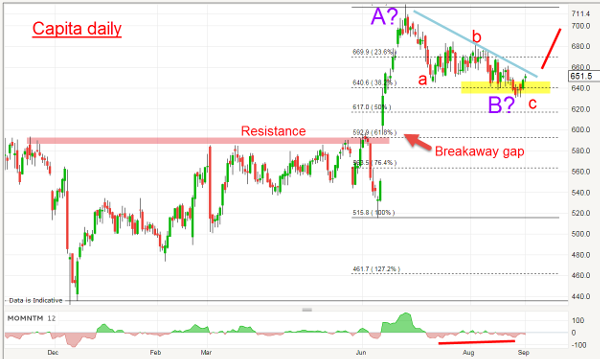
The rally off the December low was a stilted affair with no clear trend, as this was a period of re-distribution where stale longs threw in the towel and eager bargain hunters lapped up the offerings. Note the pink zone that denotes heavy resistance where multiple failed attempts to break above it were thwarted - that is, until the strong breakout of 13 June in a clear Breakaway Gap.
There are several types of gap (no trading), but the Breakaway type often appears when a solid zone of support/resistance is penetrated, and is the result partly of the election of a whole pile of buy stops previously placed there by the shorts. Canny traders often place entry buy orders just above resistance zones in the hope of catching such an explosive up move, as here.
I believe this gap is very important to how the chart develops. After the thrust up, aided by short covering to above £7 in late June, the market has been digesting that 'unexpected' rally. Note that it appears to be corrective to the main uptrend in a typical A-B-C form which has carried to the Fibonacci 38% support at £6.40 on a momentum divergence.
This has all the hallmarks of a coiled spring ready to leap higher and which a break above the blue minor trendline should confirm. If so, then my purple wave labels should apply and we will be in the final wave C up.
Also, if the gap is not closed soon, it will signal a resumption of the uptrend.
If we go back to the top chart, under this scenario, my first target is in the £7.50-£8 area which I expect to be reached fairly swiftly.
But even if this does not pan out, what I have done is locate a likely trade at very low risk. And low risk trades are what I always aim for. You can place stop loss orders just underneath the recent low to protect in case of further declines to lower Fibonacci levels.
Why do I like low risk trades? Simply because if wrong, I am not kept worrying what to do. I am out at a small loss to my capital and I can then seek out other likely trades - even possibly get back into this one at a better price!
And because the news follows the market, if the shares do climb towards the £8 level, I forecast that some bullish news will be released about then - perhaps a major government contract or a dividend hike?
In any case, all rallies appear to be relief rallies and, as such, will turn into a renewed downtrend when terminated. I do not believe the trade is a long-term hold. But for a trader, there is a decent potential gain available.
These articles are provided for information purposes only. Occasionally, an opinion about whether to buy or sell a specific investment may be provided by third parties. The content is not intended to be a personal recommendation to buy or sell any financial instrument or product, or to adopt any investment strategy as it is not provided based on an assessment of your investing knowledge and experience, your financial situation or your investment objectives. The value of your investments, and the income derived from them, may go down as well as up. You may not get back all the money that you invest. The investments referred to in this article may not be suitable for all investors, and if in doubt, an investor should seek advice from a qualified investment adviser.
Full performance can be found on the company or index summary page on the interactive investor website. Simply click on the company's or index name highlighted in the article.
Disclosure
We use a combination of fundamental and technical analysis in forming our view as to the valuation and prospects of an investment. Where relevant we have set out those particular matters we think are important in the above article, but further detail can be found here.
Please note that our article on this investment should not be considered to be a regular publication.
Details of all recommendations issued by ii during the previous 12-month period can be found here.
ii adheres to a strict code of conduct. Contributors may hold shares or have other interests in companies included in these portfolios, which could create a conflict of interests. Contributors intending to write about any financial instruments in which they have an interest are required to disclose such interest to ii and in the article itself. ii will at all times consider whether such interest impairs the objectivity of the recommendation.
In addition, individuals involved in the production of investment articles are subject to a personal account dealing restriction, which prevents them from placing a transaction in the specified instrument(s) for a period before and for five working days after such publication. This is to avoid personal interests conflicting with the interests of the recipients of those investment articles.