Chart of the week: A bank share flashing warning signs
11th September 2017 12:01
HSBC hits my upside target at £7.70
With the general bullish enthusiasm for all investments Asian (and especially Chinese), has had a superb run of late. After all, the H stands for Hong Kong and S for Shanghai! It has been a leading bank in the region for a very long time – and China remains hot.
But this bullish performance has been at odds with the other UK-based banking group, (and, dare I say, ) whose share weakness I observed in my COTW of 29 August.
I believe this divergence, which has existed for some time, is coming to an end and it will be HSBC that joins the other banks in the bear market that is underway in the major banks. Here, I will present my evidence for this view based on the chart patterns.
Do you remember 2006? That was when HSBC topped out at £9 a share and then began a horrendous bear market that culminated in March 2009 at the £2.70 low. That was during the bank debt crisis, of course, when the run on Northern Rock sent bank shares sharply lower.
But my point is that HSBC peaked a full eight months before the FTSE 100 index topped in July 2007. And Barclays made its top in February 2007, with Lloyds topping in March, and both were already heading south as the FTSE topped in July.
It makes perfect sense to expect banks to lead the general market down in a period of deflation (a decline in money and credit) and, if history is any guide (as it usually is), they will lead the upcoming Big One down.
I believe HSBC is now about to turn down in a major bear trend. Here is the very long-term monthly chart, and there are two remarkable alignments on it:
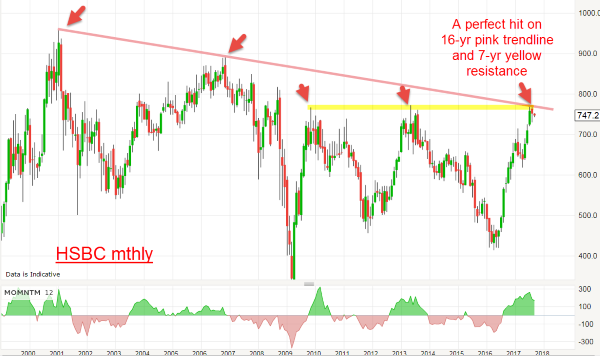
I have drawn in the pink straight line connecting the major highs of 2001 and 2006 and simply extended it. Lo and behold, it just touches the recent £7.70 high with extreme accuracy! That is a magnificent 16-year line of resistance. Who says markets don't have memories?
Not only that, but the yellow zone covers the previous major highs since 2013 and, as I extended it, it also passes through the £7.70 high. That makes the £7.70 area a zone of very high resistance.
So, what are the odds of the market making a major turn down here? After all, the market could extend past the £7.70 level in a show of strength. But it would take an enormous amount of buying power to do it. Much buying power has already been spent in getting the market to climb from £2.70 to the current £7.70 area.
Let's zoom in on the weekly chart showing the latest rally phase off the April 2016 low:
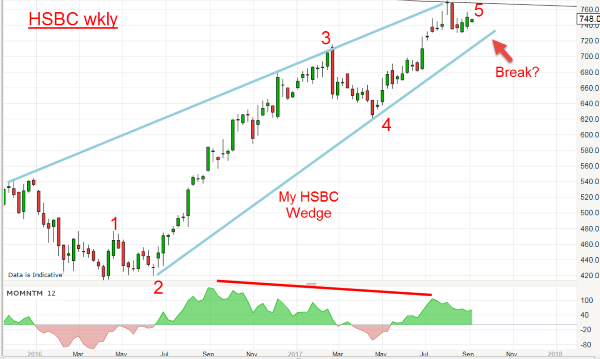
I can draw an excellent Wedge pattern within which is a five-up with a long and strong wave 3 and a momentum divergence into wave 5. The top of wave 5 lines up perfectly with the upper wedge line at £7.70. Is this a coincidence?
If I had sat down in February when the wave 3 high was being put in, I could not have come up with a more accurate target for wave 5. Just extending the upper wedge line and where it met the pink and yellow extensions in the top chart would give me the £7.70 target! This is a triple whammy for the bull.
Putting all of this together, it appears we are at or very near a major high. A clear break of the lower Wedge line at around the £7.20 level should confirm. If this occurs, my first target will be the wave 4 low at the £6.40 area.
This article is for information and discussion purposes only and does not form a recommendation to invest or otherwise. The value of an investment may fall. The investments referred to in this article may not be suitable for all investors, and if in doubt, an investor should seek advice from a qualified investment adviser.
These articles are provided for information purposes only. Occasionally, an opinion about whether to buy or sell a specific investment may be provided by third parties. The content is not intended to be a personal recommendation to buy or sell any financial instrument or product, or to adopt any investment strategy as it is not provided based on an assessment of your investing knowledge and experience, your financial situation or your investment objectives. The value of your investments, and the income derived from them, may go down as well as up. You may not get back all the money that you invest. The investments referred to in this article may not be suitable for all investors, and if in doubt, an investor should seek advice from a qualified investment adviser.
Full performance can be found on the company or index summary page on the interactive investor website. Simply click on the company's or index name highlighted in the article.
Disclosure
We use a combination of fundamental and technical analysis in forming our view as to the valuation and prospects of an investment. Where relevant we have set out those particular matters we think are important in the above article, but further detail can be found here.
Please note that our article on this investment should not be considered to be a regular publication.
Details of all recommendations issued by ii during the previous 12-month period can be found here.
ii adheres to a strict code of conduct. Contributors may hold shares or have other interests in companies included in these portfolios, which could create a conflict of interests. Contributors intending to write about any financial instruments in which they have an interest are required to disclose such interest to ii and in the article itself. ii will at all times consider whether such interest impairs the objectivity of the recommendation.
In addition, individuals involved in the production of investment articles are subject to a personal account dealing restriction, which prevents them from placing a transaction in the specified instrument(s) for a period before and for five working days after such publication. This is to avoid personal interests conflicting with the interests of the recipients of those investment articles.
Editor's Picks