Data watch: GDP and other economic health indicators
23rd October 2017 09:26
by Emil Ahmad from interactive investor
Share on
US
The week started pretty quietly but picked up on Tuesday with a couple of key releases. Industrial Production (MoM) was consistent with expectations, rising by 0.3% in September despite significant overall Q3 losses. This factory, mines and utilities output measure was affected by Hurricanes Harvey and Irma, depressing growth in total production by about 0.25% over the month.
Builder confidence also rebounded from the hurricane headwinds, with the NAHB Housing Market Index up 4 points from September's reading of 64. This gauge of market confidence for new-build single-family homes hit a five-month high.
On Wednesday, market attention turned towards Building Permits (MoM). Permits issued last month declined by 4.5% to 1.215 million units on a month-by-month basis, exceeding forecasts by 1.6%. Housing Starts also reflected falling optimism around US housing sector health, weakening by over 4% from August.
The Philadelphia Fed Manufacturing Index was a key Thursday focus as the manufacturing sector seems to have successfully navigated the oil slump. The index just hit a five-month high, gapping-up 4.1 points to 27.9. Sector bullishness is becoming infectious as growth in manufacturing activity is accelerating and hiring expectations gauges hit 33-year highs.
UK
After a relatively empty economic calendar two weeks ago, there has been a distinct pick-up. The Consumer Price Index (YoY) hit the 3% barrier in September. As transport and food prices increases drive the rises, this level of inflation has not been seen since April 2012. Bank of England hawks may gather new recruits at next month's MPC meeting, as momentum for a hiking phase grows.
Tuesday was also notable for Bank of England Governor Carney's speech. The central bank chief suggested inflation will peak in October or November, with currency depreciation the primary driver. Although Carney dismissed the concept of rate rises as a buffer against "a potential future shock", the market is still pricing in a November quarter-point hike.
On Wednesday, the Average Earnings Index + Bonus generated some noise as wage growth picked up to 2.2%, slightly exceeding forecasts of 2.1%. With 42-year unemployment lows failing to provide a significant uptick in growth, November's MPC meeting is likely to be a very close call. As wage growth continues to lag behind inflation, the squeeze on household budgets grows.
With inflationary pressures leading to five-year CPI highs, the retail sector is facing severe headwinds. Thursday 's Retail Sales (MoM) release indicated the extent of the fallout, with total sales softening by 0.8% in September, undershooting the 0.1% decrease anticipated. As disposable income becomes increasingly marginalised, Q3 year-on-year growth of 1.5% represents a four-year low.
Two key releases for the week beginning 23rd October
UK
Wednesday 25th October: Gross Domestic Product (GDP) (QoQ) Q3
Many economists consider GDP the most important indicator of all. That's because it tries to encapsulate the overall health of the economy in a single number. GDP is measured in percentage terms over the prior three months, with a positive reading indicative of a growing economy and a negative figure signifying contraction. The economy is officially considered to be in recession if there are two consecutive three month periods of contraction.
There are three methods of calculating GDP which should theoretically produce the same outcome. Firstly, as the name suggests, the 'income measure' looks at the overall amount of income generated by focusing on wages and profits. Secondly, the 'expenditure measure' analyses the value of goods and services purchased by the government and households, while also assessing investment in machinery and buildings.
Additionally, net exports form part of the calculation (exports minus imports). The final method is called the 'output measure' which evaluates goods and services generated by every sector of the economy.
GDP is an indispensable economic statistic for the following reasons:-
• As the primary measure of economic health in the UK, it plays a pivotal role in setting interest rates.
• It is used by the government in formulating economic policy. For example, if the economy was in recession, the government may adjust fiscal policy (taxation and spending) to compensate for reduced tax receipts.
• All EU members have to contribute to the union's budget, and GDP is used to establish different nations' payments.
• In terms of global economics, GDP will be used by various organisations (IMF, World Bank) to compare the performance of different countries.
It is important to remember that GDP is not an all-encompassing measure of economic performance. Here are some factors not reflected by this indicator:
• Some factors which may have value but cannot be quantified in monetary terms i.e. looking after elderly relatives.
• GDP offers no guidance as to the distribution of wealth or income across the UK. Growth could involve an even distribution of income or may be restricted to the wealthy elite. Realistically, it is likely to be a balance between these two extremes.
• Population growth can theoretically create a misleading impression of the economy. For example, if it significantly exceeds GDP growth, average income may fall even though the economy is expanding.
• Although we think of GDP as a reflection of economic health, some things which 'positively' contribute to the figure may not be beneficial i.e. war expenditure raising GDP.
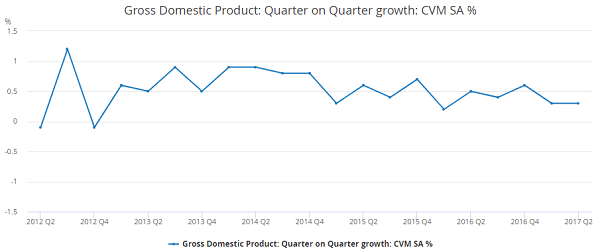
Quarter-on-quarter UK GDP growth for April-June was 0.3%, with a year-on-year rise of 1.5%. Although this is still indicative of an economy in expansion, the year-on-year rate represents the poorest level of growth since Q1 2013. Consensus is for little or no change from last time.
The Office for National Statistics (ONS) drew attention to this "notable slowdown" in 1H 2017, with the services sector the only bright spot. As inflationary pressures continue to grow, households with lower disposable incomes have been hit the hardest. Brexit uncertainty continues to weigh heavily on most sectors, although business investment growth received an upwards revision.
Analysts at Bank of America Merrill Lynch believe "only a big negative surprise on 3Q GDP can stop a [rate] hike" next month.
US
Wednesday 25th October: Durable Goods Orders (MoM)
Orders for durable goods are considered to be a very useful measurement in quantifying future economic health. It is not the same as business investment, but is a valuable substitute in assessing that very matter. Durable goods are those products which have a life expectancy in excess of three years. As this looks at products which will be utilised for quite a long period of time, this indicator can be regarded as being representative of people's medium-term economic outlook. As is the case with most indicators, a rise (in percentage terms) indicates increased manufacturing activity and is therefore bullish for the dollar.
An important factor to consider in interpreting durable goods orders is the 'aircraft effect'. Plane orders are incredibly variable and can distort monthly and quarterly figures. As these orders are volatile and take many months to fill, there is a variation of this indicator which eliminates this variable; Core Durable Goods Orders.
This methodology is similar to that used in calculating the core inflation rate, which excludes the prices of energy, food, alcohol and tobacco. The impact of aircraft orders should not be underestimated in considering durable goods orders. A former British PM blamed an election loss on this very distinction. An order of new jets were reflected in trade figures pre-election and fundamentally altered the statistics used on the campaign trial.
Some additional points to consider as regards durable goods orders:-
• They provide an indication of factory activity in the forthcoming months and by extension, a pretty decent indication of the outlook for the manufacturing sector.
• On a more specific level, this indicator provides an insight into demand for consumer items such as cars and refrigerators. It also provides an assessment of business investment, incorporating computers, industrial machinery and electric machinery.
• If companies make a commitment to increase equipment expenditure, this suggests they are in a growth phase. More investment in equipment should lead to economies of scale, enhanced productivity and potentially reduces inflationary headwinds.
• A healthy order book for durable goods should augment company profits and therefore drive stockmarket returns. Consequently, bonds and durable goods orders are inversely correlated. A weak order book will see an upturn in the fixed income market and vice versa.
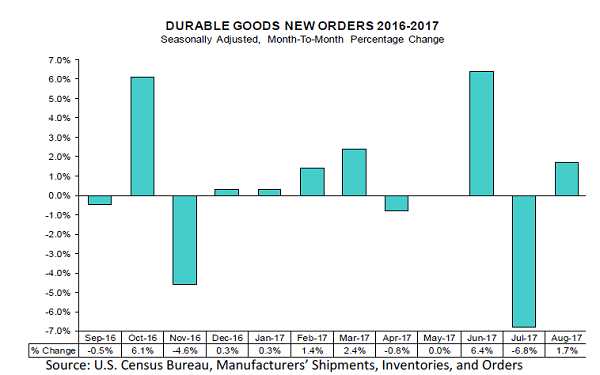
(NB – this bar chart does not reflect core orders and includes transportation items)
In August, US orders rebounded after order weakness in July (-6.8%) represented the worst monthly drop in almost three years. Orders rose by 1.7% with new transportation equipment driving the pick-up. Thirty-three new orders from Boeing saw a 44% gain in the value of aircraft orders over the month.
Reflecting the huge impact of transport, core durable goods orders were only up 0.2%, matching forecasts. Wells Fargo noted that core data suggested robust equipment expenditure in 2H 2017.
This article is for information and discussion purposes only and does not form a recommendation to invest or otherwise. The value of an investment may fall. The investments referred to in this article may not be suitable for all investors, and if in doubt, an investor should seek advice from a qualified investment adviser.