Will the Trump Trade fade in 2018?
8th December 2017 10:09
by Tom Bailey from interactive investor
Share on
US markets are once again hitting record highs. The Dow Jones recently hit a new record above 24,000, while the S&P 500 reached 2,650 and the NASDAQ looks on its way to surpassing 7,000.
The record highs continue to confound bearish commentators, who repeatedly point out that, relative to history, the US market is very expensive.
When looking at the Shiller/Cape ratio, the US market has only been expensive on three other occasions: 1929, 1999 and 2007, and we all know what happened next.
President Trump's recent success towards passing his much-anticipated tax reform - which most significantly includes a cut in corporation tax from a nominal rate of 35% to 20% - has further added to market confidence.
Indeed, the expectation of reflation borne out of fiscal policy to boost economic activity has been keeping markets buoyant since Trump won the election.
Trump has pledged to cut taxes, while also increasing infrastructure and defence spending.
Is this optimism justified? General economic data - such as GDP growth and employment levels - are good and this is expected to continue into 2018.
Likewise, corporate earnings are expected to be strong in 2018, while, when implemented, Trump's corporate tax cut will boost short-term earnings and presumably keep positive market sentiment ticking over.
Institute for Supply Management show that recent new orders are robust. As David Kohl, chief currency strategist at Julius Baer notes: "Order dynamics being very strong…suggest that the current and next quarter will be quite robust."
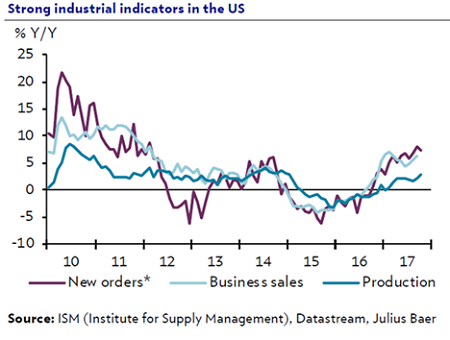
Kohl argues that business investment activity has seen the strongest improvements recently and therefore has a good chance of overtaking consumption as the cornerstone for US economic growth in 2018.
All of this has led Julius Baer to anticipate strong economic growth in 2018 and revise upwards its projections from 2.4 %/2.5% to 2.7%.
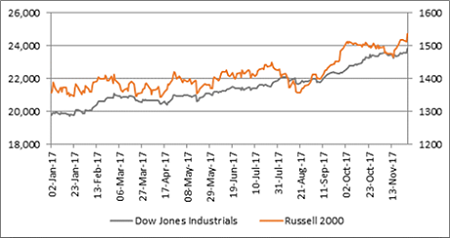
At the same time, the Russell 2000, America's main smaller companies index, is still trending upward, reaching an all-time high of its own.
That's important, as many investors view the direction of small caps are a general sign of where the economy may be headed.
Reasons to be cautious
Other indicators, however, are less positive. Take the SOX index (chart below). This index tracks firms that are involved in the manufacture, sale and distribution of semi-conductors, which owing to their wide variety of uses in goods produced across the economy, are a good barometer of general economic health.
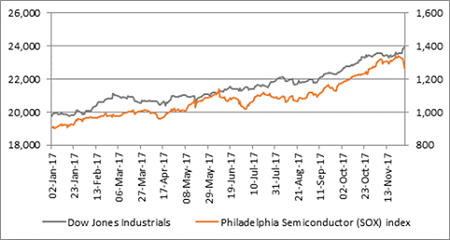
On this front, the news is not so good. After a wobble in May, the SOX fell by 4.4% on Wednesday 29 November.
This could just be short-term blip. Alternatively, it could be indicative of a change the type of stocks in favour right now. Worst case, however, the recent dip may be a warning of a coming slowdown in US economic activity and declining optimism in markets.
Another mixed indicator that investors should keep an eye on is the Dow Jones Transportation Index. This includes airline, trucking and rail firms - companies involved in the shipment of goods.
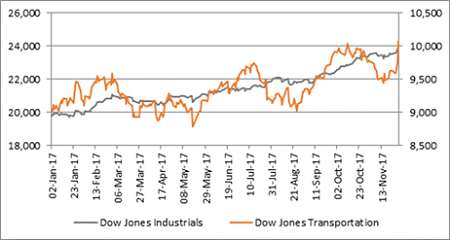
Whether this index is in negative or positive territory isn't quite so clear right now. On the one hand, the Transportation index has been lagging the Dow Jones Industrial index.
Falling behind industrials potentially spells trouble ahead. On the other hand, Wednesday 29th November saw a handsome gain for the index, suggesting positive economic activity ahead.
This article was originally published in our sister magazine Money Observer. Click here to subscribe.
This article is for information and discussion purposes only and does not form a recommendation to invest or otherwise. The value of an investment may fall. The investments referred to in this article may not be suitable for all investors, and if in doubt, an investor should seek advice from a qualified investment adviser.