Here's who is leading the global dividend bonanza
20th February 2018 12:38
by Tom Bailey from interactive investor
Share on
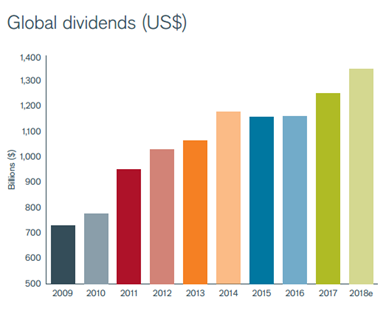
Global dividend payments rose to record levels in 2017, hitting a total of $1.252 trillion, according to Janus Henderson's latest Global Dividend Index.
Headline growth stood at 7.7%, while underlying growth - growth adjusted for exchange rate movements and one-off special dividends - stood at 6.8% in 2017. The headline growth rate for the year was the fastest seen since 2014, beating Janus Henderson's forecasts.
The surge in dividend payments was largely driven by strong global economic growth as well as rising corporate confidence - particularly in the US.

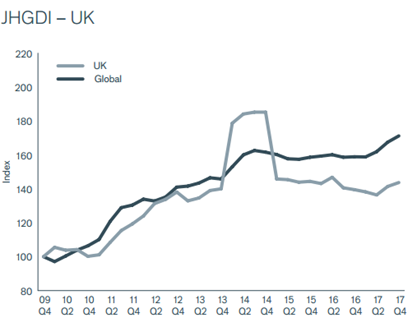
UK-listed companies saw strong dividend growth in 2017, although they lagged the rest of the world. Last year UK-listed firms saw underlying dividend growth of 10%, largely driven by mining companies restoring dividends that they had cut in previous years.
Headline growth, however, was more modest, at 3%. This was reflective of many UK companies no longer qualifying for the index of the top 1,200 dividend-paying companies in 2017 as a result of the pound's devaluation.

Janus Henderson Global Dividend Index: UK dividend index compared to global index.
Europe ex-UK also underperformed the rest of the world, with underlying dividend growth of just 2.7%. In total, European companies paid out $227.4 billion in 2017, giving a headline growth rate of just 1.9%. This was the result of both a weak euro and meagre special dividend payments.
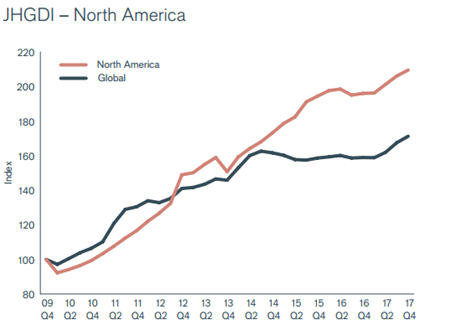
By contrast, both North America and Asia saw strong dividend growth. North American dividends enjoyed headline growth of 6.9% and underlying growth of 6.5%.
Following a weak 2016, the US surged ahead in dividend growth, with an underlying growth rate of 6.3% in 2017. In total, US companies paid their shareholders a record $438.1 billion in dividends in 2017 - an increase of $24.4 billion. Canada also saw strong performance, with underlying dividend growth coming in at 9.4% and headline growth at 19.6% in 2017.

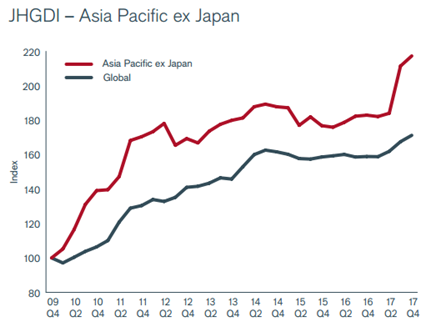
Asia ex-Japan headline dividend payments jumped by 18.8%, while underlying dividends grew by 8.6% in 2017. This was a record year for the region, with the total paid out reaching $139.9 billion. Hong Kong, Taiwan and South Korea all broke records for dividend payouts. The largest payments came from Hong Kong-listed , which was nearly able to unseat as the world's biggest dividend payer.
The region is now experiencing the fastest rate of dividend growth since 2009, surpassing North America.

Japan too saw strong growth off the back of rising profits. The country saw record payouts of $70 billion as a result of its headline growth rate of 8.1%. Underlying growth was even stronger at 11.8%.
dominated dividend payments, despite yield being flat, with the car manufacturer account for $1 of every $11 paid. Other firms such as , Nippon Telegraph, KDDI and Mitsubishi Corporation raised their dividends by double digit figures.
Emerging market dividend growth was more mixed. Some economies were buoyed by rising energy prices: for example Russia had an underlying growth rate of 35.7% for this reason. Likewise, helped boost Chinese dividend payouts, giving it a headline increase of 5.5% and underlying growth of 3.1%.
Brazil and India saw respectable underlying growth, with the former achieving 6.5% and the latter 3.7%. South Africa, meanwhile, saw total dividend payouts fall.
This article was originally published in our sister magazine Money Observer, which ceased publication in August 2020.
These articles are provided for information purposes only. Occasionally, an opinion about whether to buy or sell a specific investment may be provided by third parties. The content is not intended to be a personal recommendation to buy or sell any financial instrument or product, or to adopt any investment strategy as it is not provided based on an assessment of your investing knowledge and experience, your financial situation or your investment objectives. The value of your investments, and the income derived from them, may go down as well as up. You may not get back all the money that you invest. The investments referred to in this article may not be suitable for all investors, and if in doubt, an investor should seek advice from a qualified investment adviser.
Full performance can be found on the company or index summary page on the interactive investor website. Simply click on the company's or index name highlighted in the article.