Chart of the week: Is BP a buy here?
26th February 2018 12:20
by John Burford from interactive investor
Share on
Since made its high last month, I believe stocks are generally in trading mode, not for long-term investing. Why? Simply because I believe in following the age-old wisdom of buying low and selling high. Sadly, because most become more bullish as stocks extend bull runs, they do the reverse. Buying high and selling low has never been a successful strategy for me.
That is why I consider stocks are for trading in this period.
The oil majors have taken a hit in recent days as the oil price has moved down off its highs. The mainstream media is full of gloom and doom stories about the rampant US shale production that will 'inevitably' crash the oil price. The feeling is that Russia and OPEC are getting into bed in a desperate but fruitless bid to prevent that.
If there is one thing you can be reasonably sure of is this: when something is 'inevitable' in the market, it rarely happens - at least for a while. That traps an awful lot of wrong-way bets right at a major turn with the inevitable (sorry) scramble to cover losing positions.
So, I am wondering if the currently oversold position in the oil majors is a buying opportunity. Here is the chart going back to the 2006 high at the 720p high when crude was trading above the $100 area. The subsequent low at 300p in 2010 occurred as US crude traded below the $30 level in 2009.
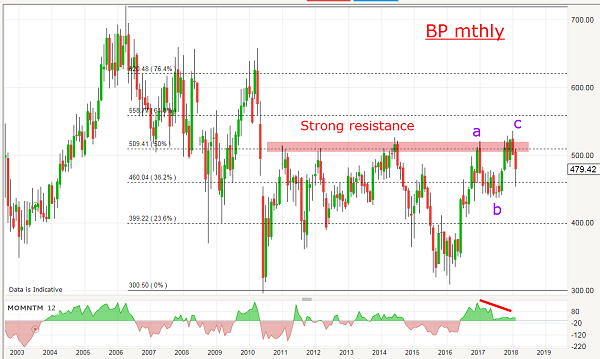
Since then, despite a decent recovery in crude, it has failed to move above the very powerful resistance at the 510p area, and the latest attempt last month was likewise thwarted.
Note the rally to that high was built on a huge momentum divergence that indicated the c wave rally was much weaker than in the a wave. That is normally a warning sign to expect a reversal back down.
So, should we be looking at a short trade? Not necessarily, because the monthly chart indicates only the long-term trend, it is of little help in pinpointing the current shorter-term trend. Here is the daily for that purpose:
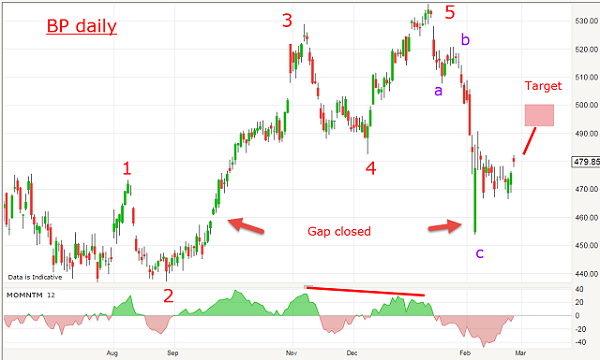
I have a pretty five-up to the January 530p high on a momentum divergence and then a three-down to the 455p level which closed a small gap in September. Remember, gaps act as magnets, no matter how old they are!
So now the odds favour a rally to at least the pink zone which is a 50% retrace of the move down. And if crude oil can build on recent strength, the outlook is for even higher prices.
But, in reality, this share is never going to be in bitcoin’s league. It is the traditional 'widows and orphans' category but, even so, astute traders can still profit.
ii publishes information and ideas which are of interest to investors. Any recommendation made in this article is based on the views of the writer, which do not take into account your circumstances. This is not a personal recommendation. If you are in any doubt as to the action you should take, please consult an authorised investment adviser. ii do not, under any circumstances, accept liability for losses suffered by readers as a result of their investment decisions.
The value of your investments, and the income derived from them, may go down as well as up. You may not get back all the money that you invest.
These articles are provided for information purposes only. Occasionally, an opinion about whether to buy or sell a specific investment may be provided by third parties. The content is not intended to be a personal recommendation to buy or sell any financial instrument or product, or to adopt any investment strategy as it is not provided based on an assessment of your investing knowledge and experience, your financial situation or your investment objectives. The value of your investments, and the income derived from them, may go down as well as up. You may not get back all the money that you invest. The investments referred to in this article may not be suitable for all investors, and if in doubt, an investor should seek advice from a qualified investment adviser.
Full performance can be found on the company or index summary page on the interactive investor website. Simply click on the company's or index name highlighted in the article.
Disclosure
We use a combination of fundamental and technical analysis in forming our view as to the valuation and prospects of an investment. Where relevant we have set out those particular matters we think are important in the above article, but further detail can be found here.
Please note that our article on this investment should not be considered to be a regular publication.
Details of all recommendations issued by ii during the previous 12-month period can be found here.
ii adheres to a strict code of conduct. Contributors may hold shares or have other interests in companies included in these portfolios, which could create a conflict of interests. Contributors intending to write about any financial instruments in which they have an interest are required to disclose such interest to ii and in the article itself. ii will at all times consider whether such interest impairs the objectivity of the recommendation.
In addition, individuals involved in the production of investment articles are subject to a personal account dealing restriction, which prevents them from placing a transaction in the specified instrument(s) for a period before and for five working days after such publication. This is to avoid personal interests conflicting with the interests of the recipients of those investment articles.