Chart of the week: A great call on US tech shares
9th April 2018 12:09
by John Burford from interactive investor
Share on
Alphabet follows my roadmap
My COTW of 19 March warned of a likely imminent collapse in these shares as they traded around the $1,160 area. There are very few market commentators who are gutsy enough to publicly come out with such specific bold forecasts in real time. The reason is obvious - if you get in wrong, you lose credibility and are left with egg on your face. There may be a little upside but plenty of downside!
Of course, that does not apply to salaried analysts who seem to go from bad call to bad call unscathed.
Chart of the week: Time to bet against Google?
Most independent pundits hedge around and will only make firm forecasts after the event. By then, all is now clear, but how can you get a drink if you are too late to the party?
As we all know, timing may not be everything, but it certainly is essential if you are going to profit from your analysis. Getting into a trend too early is just as bad as if you had wrongly guessed the direction. For traders, you must get into a new trend as quickly as possible - and be correct.
Of course, the vast majority cannot do this with any consistency. The ideal is to get into a trade which then moves immediately in your direction with no risk to your stop loss. That is what I try to do in my work.
So here was the picture for Google-owner last time:
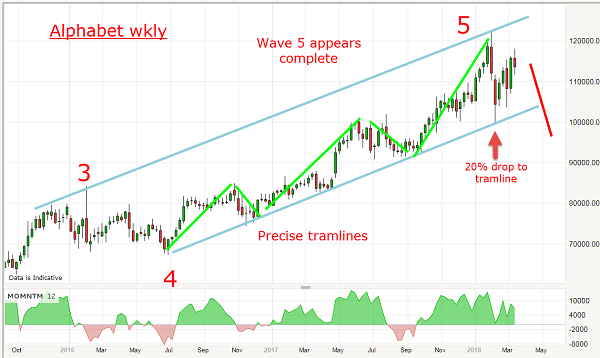
Source: interactive investor Past performance is not a guide to future performance
I noted that the rise off the 2009 Credit Crunch lows was almost exponential, and these moves always end with a blow-off and then a rapid descent. That is why I was looking for that blow-off - and believed I had found it when my final wave 5 had topped just above $1,200 on 1 February as the market hit my upper blue tramline on the button.
The subsequent mini-collapse to the $1,000 area was a direct hit on my lower tramline and, by mid-March, it had rallied back as the Dip Buyers exercised their well-honed Pavlovian instincts perfected in the previous years of the bull run.
But, as I noted last time, the bounce had carried to the Fibonacci 76% retracement of the decline, which is always my 'moment of truth' level. If the rally was genuine, the shares would continue upwards, but if this was the final resistance level, they would head south.
For a trader, this is an ideal set-up for a contrary trade (contrary to consensus opinion, which is bullish). A short trade there could be protected by a close stop just above that level. As I wrote last time: "Getting this right should result in massive profits."
So, let's see how that panned out:
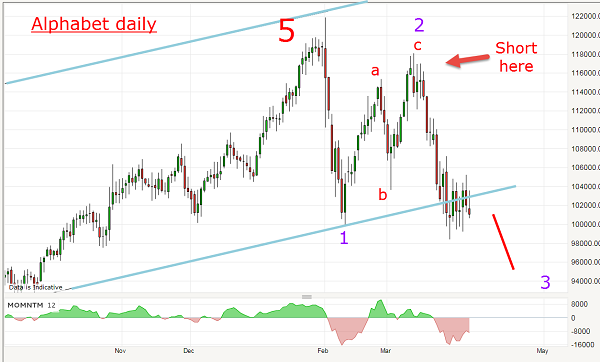
Source: interactive investor Past performance is not a guide to future performance
A few days spent testing the resistance at the $1,160-$1,180 area, and then the market fell out of bed with a vengeance right back to test the lower tramline in the $1,000 level. This is an area where some profits can be taken.
The most bearish case I can make here is for the market to drop sharply, well below the 'psychological' round number $1,000 as wave 3 does its destructive work. A less bearish option is for the shares to stage a bounce from here.
If the tramline support remains in operation, we could see further work between the tramlines before the downtrend resumes.
As I pointed out last time, sentiment towards the previously untouchable US Tech Titans is turning much more negative and this will weigh heavily on the shares this year.
These articles are provided for information purposes only. Occasionally, an opinion about whether to buy or sell a specific investment may be provided by third parties. The content is not intended to be a personal recommendation to buy or sell any financial instrument or product, or to adopt any investment strategy as it is not provided based on an assessment of your investing knowledge and experience, your financial situation or your investment objectives. The value of your investments, and the income derived from them, may go down as well as up. You may not get back all the money that you invest. The investments referred to in this article may not be suitable for all investors, and if in doubt, an investor should seek advice from a qualified investment adviser.
Full performance can be found on the company or index summary page on the interactive investor website. Simply click on the company's or index name highlighted in the article.
Disclosure
We use a combination of fundamental and technical analysis in forming our view as to the valuation and prospects of an investment. Where relevant we have set out those particular matters we think are important in the above article, but further detail can be found here.
Please note that our article on this investment should not be considered to be a regular publication.
Details of all recommendations issued by ii during the previous 12-month period can be found here.
ii adheres to a strict code of conduct. Contributors may hold shares or have other interests in companies included in these portfolios, which could create a conflict of interests. Contributors intending to write about any financial instruments in which they have an interest are required to disclose such interest to ii and in the article itself. ii will at all times consider whether such interest impairs the objectivity of the recommendation.
In addition, individuals involved in the production of investment articles are subject to a personal account dealing restriction, which prevents them from placing a transaction in the specified instrument(s) for a period before and for five working days after such publication. This is to avoid personal interests conflicting with the interests of the recipients of those investment articles.