Chart of the week: Where next for BP shares?
23rd April 2018 11:24
by John Burford from interactive investor
Share on
Actually. BP was a buy
On February 26, I asked the question: Is a 'buy' here when the shares were trading at around the 480p area. Today it is trading in the 520p region.
For one of the snail-paced stalwarts of the , that is a decent move -but is there more to go for?
Let's review my thinking that suggested this move. Back then, the shares had taken a hit from the 530p area way down to 450p and the chart looked pretty dreadful - if you did not have some understanding of how Elliott waves work, that is!
• Chart of the week: Is BP a buy here?
This was my reading of the Elliott picture then:
Source: interactive investor Past performance is not a guide to future performance
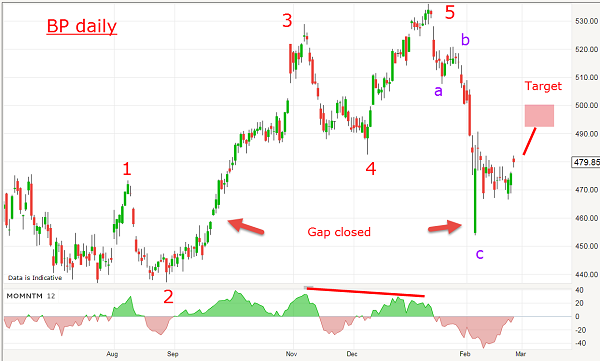
From the lows last August, I had a lovely five waves up with a very long and strong third wave, which is typical. When I see such a structure, I know that the odds favour an interpretation that says the main trend is up.
And following Elliott's rules, after a five wave 'impulse' pattern comes a correction against the main trend usually in three waves (or some combination thereof). And that was precisely what was presented to me.
And with the closure of the gap, I forecast that the shares would soon continue their upward recovery. This is what I noted then:
"So now the odds favour a rally to at least the pink zone which is a 50% retrace of the move down. And if crude oil can build on recent strength, the outlook is for even higher prices."
And that is precisely what transpired: crude oil prices have recovered to a recent high and the shares have marched northwards. This is the current setup:
Source: interactive investor Past performance is not a guide to future performance
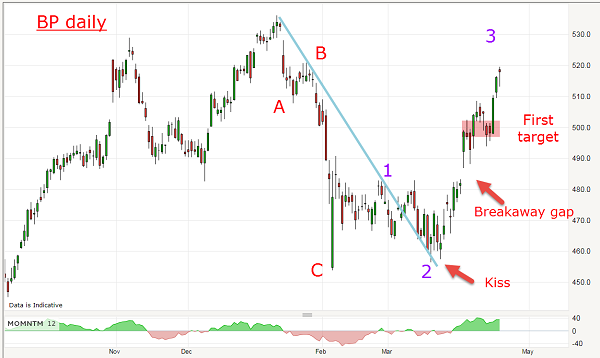
Right after my post, the shares dipped one more time, but right to the blue trendline where it planted a "kiss" and then began a vigorous rally which produced a bullish breakaway gap just above the minor highs as shorts ran for cover. That was confirmation the main trend had resumed.
Then, it paused briefly at my first target and is now pushing up towards the long-term resistance zone at the 520–530p area. The strength of the rally is telling me this is a minor third wave of what should be another five-wave impulsive pattern.
If correct, I expect the 530p high to be exceeded and the long seven-year resistance zone there to be broken. That would be a major event and even 'fundamental' analysts would have to take note.
It appears the rally has legs and, if crude prices can exceed the $75 (Brent) area, I can see BP trading up to the next major resistance at the 560p region with higher potential.
That would surprise a whole lot of analysts who are mostly bearish the fossil fuel sector!
Full performance can be found on the company or index summary page on the interactive investor website. Simply click on the company's or index name highlighted in the article.
These articles are provided for information purposes only. Occasionally, an opinion about whether to buy or sell a specific investment may be provided by third parties. The content is not intended to be a personal recommendation to buy or sell any financial instrument or product, or to adopt any investment strategy as it is not provided based on an assessment of your investing knowledge and experience, your financial situation or your investment objectives. The value of your investments, and the income derived from them, may go down as well as up. You may not get back all the money that you invest. The investments referred to in this article may not be suitable for all investors, and if in doubt, an investor should seek advice from a qualified investment adviser.
Full performance can be found on the company or index summary page on the interactive investor website. Simply click on the company's or index name highlighted in the article.
Disclosure
We use a combination of fundamental and technical analysis in forming our view as to the valuation and prospects of an investment. Where relevant we have set out those particular matters we think are important in the above article, but further detail can be found here.
Please note that our article on this investment should not be considered to be a regular publication.
Details of all recommendations issued by ii during the previous 12-month period can be found here.
ii adheres to a strict code of conduct. Contributors may hold shares or have other interests in companies included in these portfolios, which could create a conflict of interests. Contributors intending to write about any financial instruments in which they have an interest are required to disclose such interest to ii and in the article itself. ii will at all times consider whether such interest impairs the objectivity of the recommendation.
In addition, individuals involved in the production of investment articles are subject to a personal account dealing restriction, which prevents them from placing a transaction in the specified instrument(s) for a period before and for five working days after such publication. This is to avoid personal interests conflicting with the interests of the recipients of those investment articles.