Here's how stockmarkets typically perform in June
5th June 2018 16:09
by Stephen Eckett from interactive investor
Share on
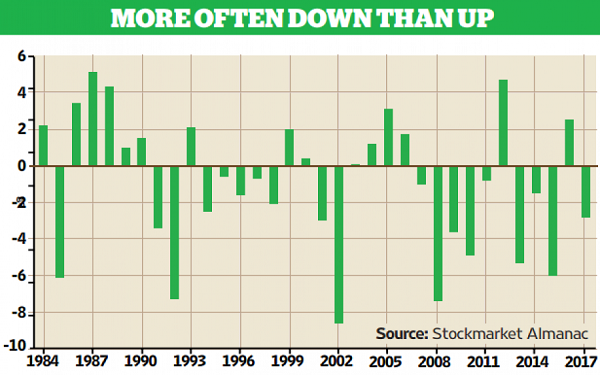
A quick glance at the chart below shows that June is not usually a good month for equities.
The chart shows the month's returns from the FTSE All-Share index from 1984; one can easily see the market falls more often than it rises in June. And when the market does decline, the falls can be quite large, whereas the positive returns are usually only modest.
In the 48 years since 1970 the market has seen positive returns in June 21 times, with an average month return of -1%.
In recent years the record is even worse. In the 18 years since 2000, the market has seen positive returns in June just seven times (36%), with an average month return of -1.7%.
Last year continued the trend, with a 2.8% market fall in June. Not surprisingly, the month has the second-worst record for equity returns; moreover, the May-June period has been the weakest two-month period in the year for the market.
Past performance is not a guide to future performance
In an average June the market starts strong, hitting its month high on the second or third trading day, but prices then drift down steadily for the rest of the month, although the market ends on a positive note - the last trading day is the second strongest in the year.
June is the quietest month for results from FTSE 100 companies, with just two companies making announcements.
However, it is quite a busy month on the economics front, including the FOMC interest rate announcement on 13 June, ECB Governing Council Meeting on the 14 June, and the Monetary Policy Committee interest rate announcement on the 21 June.
Then 15 June sees Triple Witching and also the announcement of any changes in the FTSE 100 and other FTSE indices.
These articles are provided for information purposes only. Occasionally, an opinion about whether to buy or sell a specific investment may be provided by third parties. The content is not intended to be a personal recommendation to buy or sell any financial instrument or product, or to adopt any investment strategy as it is not provided based on an assessment of your investing knowledge and experience, your financial situation or your investment objectives. The value of your investments, and the income derived from them, may go down as well as up. You may not get back all the money that you invest. The investments referred to in this article may not be suitable for all investors, and if in doubt, an investor should seek advice from a qualified investment adviser.
Full performance can be found on the company or index summary page on the interactive investor website. Simply click on the company's or index name highlighted in the article.
This article was originally published in our sister magazine Money Observer, which ceased publication in August 2020.
These articles are provided for information purposes only. Occasionally, an opinion about whether to buy or sell a specific investment may be provided by third parties. The content is not intended to be a personal recommendation to buy or sell any financial instrument or product, or to adopt any investment strategy as it is not provided based on an assessment of your investing knowledge and experience, your financial situation or your investment objectives. The value of your investments, and the income derived from them, may go down as well as up. You may not get back all the money that you invest. The investments referred to in this article may not be suitable for all investors, and if in doubt, an investor should seek advice from a qualified investment adviser.
Full performance can be found on the company or index summary page on the interactive investor website. Simply click on the company's or index name highlighted in the article.