Trading the wedge - a most powerful chart pattern
30th October 2014 09:27
by John Burford from interactive investor
Share on
This is the last in a series of four articles where I will explain how I use my tramline system to actively trade the markets for profit. Warning: I am not a buy-and-hold man (the FTSE is trading at the same level as in December 2007 - over six years ago!). Nor am I a "story" man, unless it is a minority opinion.
I developed my simple tramline system over several years to give me a set of rules which can provide me with trade entries at low risk. The low risk requirement was crucially important because no matter how firmly I believe in my trade, I could be wrong! And I wanted my wrong trades to hand me the smallest possible loss to my account. I figured the winners would take care of themselves.
The first part of each article will contain an extract from my book Tramline Trading and which illustrates one of my five favourite trade setups that I detail in Chapter 4. The second part will illustrate the setup with a current example.
Trading the wedge
I love the wedge! It is a very reliable chart pattern that warns of an impending trend change if it occurs near the end of a long trend. Some traders call it an ascending/descending triangle or an ending diagonal. It is formed from a pattern where the support and resistance lines converge and travel in the same direction. These end-of-trend patterns do not come along every day, though. But when they do, I like to take the trades very seriously.
Let's look at a fabulous long-term example in Alcoa (AA), which I had been tracking since making its low in 2012. My interest was sparked by the divergence of the main US stock averages, which were in strong rally mode, to that of Alcoa, which had fallen from a high near $50 in 2007 to the $6 area in the same period. Intriguingly, Alcoa was one of the 30 components of the Dow Jones Industrials (until demoted in 2013) and is traded on high volumes.
Naturally, there were good reasons for the decline: aluminium was in over-supply and its price was dropping along with a general decline in the commodity sector. At one point I noted that Alcoa was the most heavily shorted stock in the DJIA. If the market could rally off a base, a good short squeeze could develop. And since late 2011, it looked to me as if it was forming such a base.
This chart shows the picture in October 2013 on the daily chart:
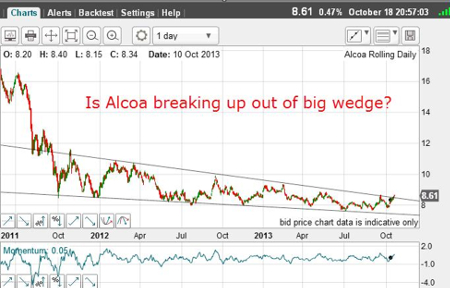
(click to enlarge)
The market had been trading between the support and resistance lines of my large, multi-month wedge. Remember, this came after the market had suffered a large trending decline off the $50 area, which made the wedge noteworthy as a possible signal to get ready to cover shorts and go long if the wedge was an ending pattern, as seemed highly likely.
Naturally, the touch points are not all perfectly accurate, but there are enough hits and near-misses to give me high confidence that if the market could break up from this formation, the move should be sharp and strong.
Here is the updated chart from three months later:
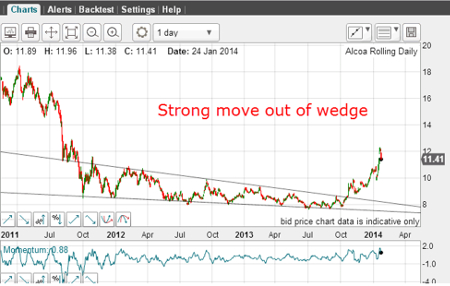
(click to enlarge)
As expected, the upward break was sharp and now the uptrend slope is much sharper than the downside moves within the wedge. This has all the hallmarks of a major trend change.
When you have identified a wedge at the end of a long downtrend, what is the best way to play it?
I like to place entry buy stops just above the most recent significant high and just above the down-sloping line. On the top chart (Figure 4.4.01), there was just such a high in the 8.60 area.
Another example in the Dow on the hourly chart is shown here:
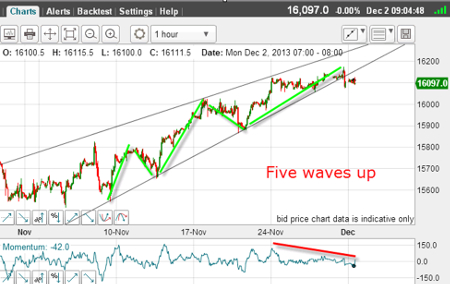
(click to enlarge)
I was looking for a top since momentum was waning and I could count five waves in the latest rally leg. Also, the wedge pattern appeared after a long bull run. My lower wedge line has several accurate touch points, which meant that I could rely on it as a solid line of support and a break of it would likely signal a trend change - at least on the hourly chart. I reckoned that a break of this line should signal at least a temporary change of trend. There should be at least 200-300 pips in a short trade since that would be a 50% retrace of the leg up - a common retrace level.
This chart shows how the trade developed:
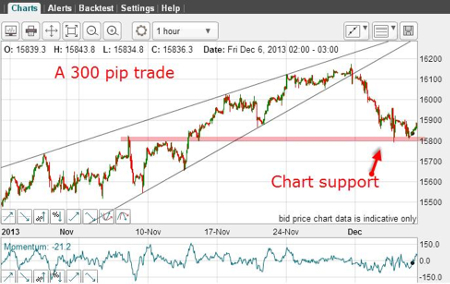
(click to enlarge)
As I suspected, the break of the wedge produced a sharp decline to give an approximate 300 pip gain which could have been taken since the market had fallen into chart support and a Fibonacci 50% correction.
Of course, a trader may have been looking for a major trend change here, but I am a relatively conservative trader and will take that profit on at least part of my position. For short-term trading, the most advantageous attitude is to enter a short trade on high bullishness and exit it on high bearishness.
Here is another example on the 15-min chart of the EUR/USD:
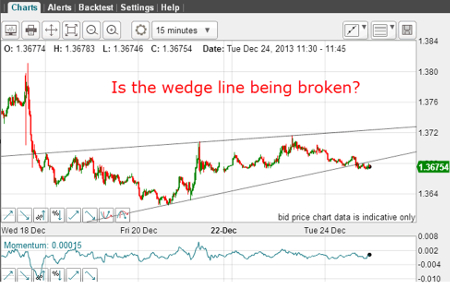
(click to enlarge)
I have three very accurate touch points on my upper wedge line (resistance) and three touch points on my lower wedge line. But with only three widely-spaced touch points on this lower line, I am unable to place high confidence that I have a wedge working. In any case, the pattern does not appear after a long trending move.
I will pass on this as it does not qualify as a potential wedge trade.
But here is a great workable example in the USD/JPY:
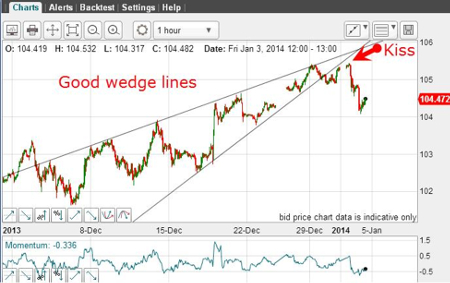
(click to enlarge)
The market had been rallying persistently from the 98 area and this wedge came at the end of a long run. I am able to draw some excellent wedge lines that contain multiple accurate touch points. The lower wedge line break was followed by a rally to kiss the underside of the line and then a scalded cat bounce away in a sharp move down (see Sections 3.2 and 3 6).
This was a textbook pattern; the tramline break, the kiss and then the rapid scalded cat move down. The kiss afforded an excellent opportunity to take profits on long positions and to reverse and position short using the high as guide for the protective stop.
Summary
The wedge is a terrific pattern to trade - and if the touch points are accurate, you can usually pinpoint a very precise trade entry - and locate a suitable protective stop, just in case the pattern decides to transform into something else (it does happen!).
A current example of a wedge in Standard Life
is a leading UK pension and life insurance company with a history going back to 1825. But what interests me is the chart!
Here is the daily chart going back to 2011:
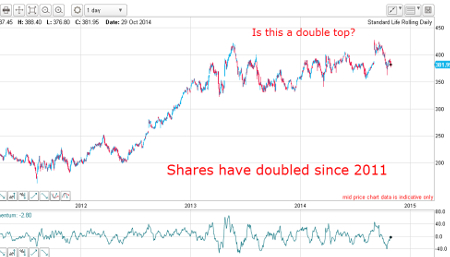
(click to enlarge)
There is so much of interest here. There is a potential double top at the 420 area, a complex five-wave pattern off the 2011 low, and a very interesting wedge pattern at the recent high.
Let's look at the hourly chart for more detail:
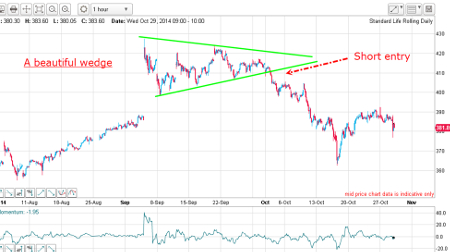
(click to enlarge)
The market surged higher on 4 September with a huge gap, but then began a month-long consolidation in the form of a beautiful wedge. Remember, this wedge was formed after a long rally phase from the 2011 lows.
And when the lower wedge line was broken in early October, it was downhill from there. The plunge low of 16 October was relieved by the counter-trend rally to the 390 area, which is a Fibonacci 50% retracement of the entire decline.
It appears that the Elliott Wave pattern suggest the recent 390 high was wave 4 and the market is now in wave 5 down.
About the author
John C Burford is an ex-NASA scientist who defected to the financial world because it seemed to offer more mystery - and challenge. John is the well-known author of the MoneyWeek Trader emails where he illustrates aspects of his tramline system in real time markets.
 About the book
This book is an "in the trenches" practical guide on how to swing trade using John's tramline system with a heavy emphasis on money management. One of the unique features is John's trading diary of a four month period trading the swings in the Dow and gold.
An exciting new feature in financial publishing is the in-the-works Tramline Trading Alert service where you can receive timely email alerts to promising trading setups. Watch for details - out soon.
Special discount for Interactive Investor readers
RRP is £35 (paperback) and £25 (ebook) however it is available to Interactive Investor readers for the special price of £25 plus P&P for the paperback or £18 for the ebook.
- For the paperback offer enter IITTPB25 at the checkout.
- For the ebook offer enter IITTEB18 at the checkout.
Buy it here.
This article is for information and discussion purposes only and does not form a recommendation to invest or otherwise. The value of an investment may fall. The investments referred to in this article may not be suitable for all investors, and if in doubt, an investor should seek advice from a qualified investment adviser.
These articles are provided for information purposes only. Occasionally, an opinion about whether to buy or sell a specific investment may be provided by third parties. The content is not intended to be a personal recommendation to buy or sell any financial instrument or product, or to adopt any investment strategy as it is not provided based on an assessment of your investing knowledge and experience, your financial situation or your investment objectives. The value of your investments, and the income derived from them, may go down as well as up. You may not get back all the money that you invest. The investments referred to in this article may not be suitable for all investors, and if in doubt, an investor should seek advice from a qualified investment adviser.
Full performance can be found on the company or index summary page on the interactive investor website. Simply click on the company's or index name highlighted in the article.
Disclosure
We use a combination of fundamental and technical analysis in forming our view as to the valuation and prospects of an investment. Where relevant we have set out those particular matters we think are important in the above article, but further detail can be found here.
Please note that our article on this investment should not be considered to be a regular publication.
Details of all recommendations issued by ii during the previous 12-month period can be found here.
ii adheres to a strict code of conduct. Contributors may hold shares or have other interests in companies included in these portfolios, which could create a conflict of interests. Contributors intending to write about any financial instruments in which they have an interest are required to disclose such interest to ii and in the article itself. ii will at all times consider whether such interest impairs the objectivity of the recommendation.
In addition, individuals involved in the production of investment articles are subject to a personal account dealing restriction, which prevents them from placing a transaction in the specified instrument(s) for a period before and for five working days after such publication. This is to avoid personal interests conflicting with the interests of the recipients of those investment articles.