Why oil price rally has legs
3rd February 2015 11:43
by Lee Wild from interactive investor
Share on
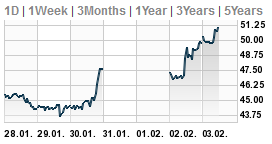
An odd thing happened at the end of last week. The oil price began to rise; and the short-term trend appears to be higher. West Texas Intermediate (WTI) is currently trading at $51.1 a barrel, up 15% since early Friday when a barrel could be bought for as little as $44.31. But with no change to the fundamentals - over supply and weaker demand - what's behind the sudden reversal of fortune?
Well, a sharp drop in the widely-watched Baker Hughes rig count helped. It revealed the number of oil rigs dropped by 94 during the week to 1,543. It was the biggest weekly fall since 1987. There are now 242 fewer rigs in action than this this time last year, which means less capacity to pump the black stuff.
Workers at a number of oil refineries in the US went out on strike Sunday, too. It's the biggest such strike since 1980 when union members stayed out for three months. A full walkout could bring almost two-thirds of US fuel output to a halt, according to reports on Bloomberg.
"Straw clutching," says oil industry expert Malcolm Graham-Wood. It may be, but a wave of short covering at month-end on Friday was behind a raft of big buy orders for both WTI and Brent crude futures contracts. And this activity has certainly got the chartists excited.

WTI one-week chart
"Brent has moved above the Kijun resistance level of $53.08 and the Kijun/Tenkan is now narrow and a crossover is imminent," explains Graham-Wood. "This would give support at $53.08 and at $51.60 whilst resistance is on the chart at $56.99."
"Now these are only charts you understand but they are as worthy straws to clutch at as anything else."
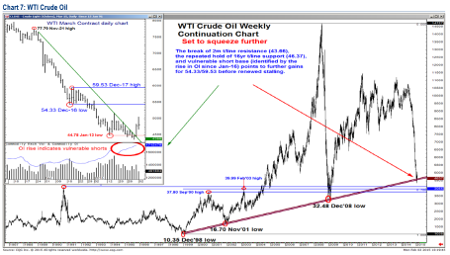
WTI set to squeeze further
Technical analysts at Bank of America Merrill Lynch have come up with some interesting ideas, too.

"Evidence suggests that Friday's surge higher in WTI has further to run," they say. "The recent surge in Open Interest, rising approximately 134k contracts since Jan - 16, indicates vulnerable short positions (open interest rises when the seller is a new short and the buyer is a new long) which are now at risk of being covered."
"With the break of 2m trend line resistance (and weekly hold of 16yr trend line support) gains should continue in the sessions ahead towards the Dec - 16 low at 54.33 before renewed stalling."
This article is for information and discussion purposes only and does not form a recommendation to invest or otherwise. The value of an investment may fall. The investments referred to in this article may not be suitable for all investors, and if in doubt, an investor should seek advice from a qualified investment adviser.