Valuation metrics reveal whether rally has legs
10th April 2015 16:46
by Lee Wild from interactive investor
Share on
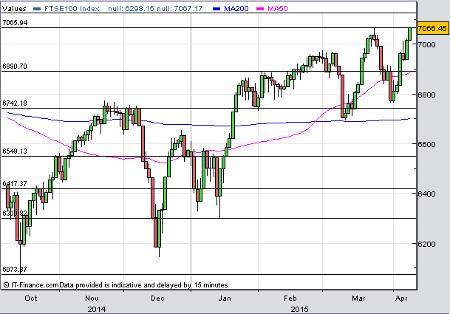
London's index has just bulldozed back through 7,000 this week to a new record high. The German DAX and S&P 500 have just made personal bests, too, while Japan's Nikkei index topped 20,000 for the first time in 15 years. Investors would be right to ask whether the market is expensive compared to historical patterns.
Certainly, from a technical view, the market could offer further upside. Chartist Alistair Strang at Trends & Targets thinks so. "Above 7050 still allows for an initial 7078 with secondary at 7094," says Strang. "If it starts trending above 6978, we will suspect early sight of another growth curve starting."
On fundamentals, the debate is muddied. That's because strategists use a variety of valuation metrics which provide different signals. In order to decide whether the market is expensive or not, we must first decide which valuation metric is the best leading indicator for future market performance.
UBS strategists Stephane Deo and Ramin Nakisa think they have the answer. Their research concludes that valuation metrics are very poor leading indicators of market performance on a short-term horizon - one to two years.
Looking up to four years out, they find that the best leading indicator is provided by the Hatheway PE (current share price/trend adjusted earnings over the sample's period), using trend adjusted earnings. Over the long term - five to ten years - the departure of the Tobin's Q (value of the stock market/corporate net worth) from its long term trend is clearly the best indicator.

For the record, Deo and Nakisa used the US market because it has data stretching back further than any other - about 60 years. Both the forward PE ratio and price-to-book value (P/BV) were dismissed as data stretching back only to 1990 allows us to identify just a couple of cycles. However, and perhaps surprisingly, during that period both metrics performed "quite poorly".
So, expensive, or not?
"Hatheway PE [named after UBS's previous head of asset allocation] for the medium term and trend adjusted Tobin's Q for the long term, are both above their long term average by one standard deviation," according to Deo and Nakisa. "This signals that the market is indeed expensive, but not abnormally so."
"Also, we note that those indicators are very good leading indicators when they are far from their long-term averages; at the current levels, though, we believe the signals are inconclusive. In short, we find little evidence of market overpricing."
Deo and Nakisa assume other markets behave like the US and that these two indicators are still the best over their respective periods. "Unfortunately the data on Tobin's Q outside of the US are inconsistent, patchy and limited in time scale. So we restrict our approach to the trend adjusted [Hatheway] PE."
"It is well known that earnings are significantly below their long-term trend in a number of European countries, hence returning to trend earning (even partly) would make the current market valuation look very cheap [the Hatheway PE is very low compared to its historical average]. This is indeed what we obtain: the signal for Europe is actually supportive of a further rally if one assumes that the trend adjusted PE is indeed, like in the US, the best leading indicator of the stockmarket."
This article is for information and discussion purposes only and does not form a recommendation to invest or otherwise. The value of an investment may fall. The investments referred to in this article may not be suitable for all investors, and if in doubt, an investor should seek advice from a qualified investment adviser.