Chart of the week: Only one way for this share to go
27th April 2015 12:57
by John Burford from interactive investor
Share on
By John C Burford, Author of Tramline Trading, and editor of MoneyWeek Trader
In these weekly articles, I will highlight a share that I believe has an interesting chart pattern. I am primarily a technical trader and use the methods I have developed that I call Tramline Trading. You can read more about my methods in my book Tramline Trading, which you can inspect here.
Most traders and investors make classic errors by chasing a stock near a top and then hang on to it too long during the decline. You will vastly improve your performance by timing your entries and exits more expertly - and that is what I hope to help you with.
My goal in these articles is to cover a share that has an interesting chart. I I developed my tramline system over several years to give me a set of rules which can provide me with trade entries at low risk. The low risk requirement was crucially important because no matter how firmly I believe in my trade, I could be wrong! And I wanted my wrong trades to hand me the smallest possible loss to my account. I figured the winners would take care of themselves.
My hope is that you glean useful ideas and employ at least some technical analysis to bolster your returns. In trading as well as investing, timing is a key factor in your eventual returns.
Smiths Group shares on a roll (downwards)
is a major engineering company that had its roots in the Victorian retail jewellery trade over a century ago. It then moved into manufacture of its famous clocks and motor and aviation instruments. It is now an international leader in the medical, communications, security and engineering fields.
In my home town, it was a major employer where many of my fellow school chums found lifetime secure employment. It was famous locally for its lavish sporting facilities!
So with the company in growth sectors, why has the share price languished recently? After all, the FTSE has been knocking on all-time highs, which should have helped to buoy sentiment towards Smiths.
The answer lies in the weekly chart:
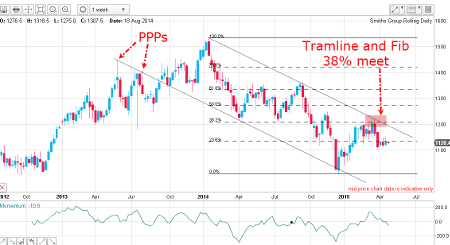
Following the high in January last year at the 1,530p level, the shares began a decline which has been following the trading channel between my textbook tramlines. The lower tramline sports two lovely Prior Pivot Points (PPP), and the latest touch in December was a slight overshoot, which is common after such a steep decline.
My upper tramline likewise is of high quality with three accurate touch points, the latest of which a month ago was also the meeting with the Fibonacci 38% retrace of the entire decline off the 2014 top.
Now, the market is moving back down inside the trading channel in an orderly way. The trend is clearly down.
So let's take a look at the hourly chart in close-up:
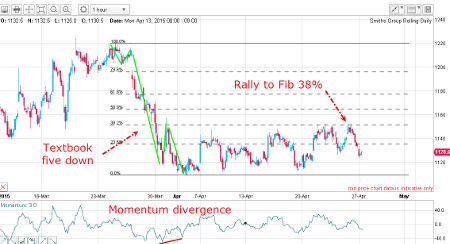
The move down off the March high touch point on the upper tramline was a classic five waves down complete with a long and strong third wave and a solid positive momentum divergence at the fifth wave low. This is a signature that the trend remains down, but to expect a relief rally, which duly materialised in April.
Normally, I expect to see an A-B-C rally in three clear waves but here, the rally is complex with many wide overlapping waves. The A-B-C pattern, if there is one, is well hidden! This zig-zag behaviour, which is typical of a complex counter-trend movement, provides yet more evidence that the trend remains down.
The hit on the Fibonacci 38% level was solid resistance that the market is currently moving away from.
Outlook
The major trend remains down from early 2014 as the share price is travelling along my down-sloping tramline pair. Also in the short-term, all evidence points to a continuation of this trend.
But if the shares can catch a bid, they may move above 1150 to another Fibonacci level, but that would not alter the bearish picture unless a jump above my upper tramline in the 1200 region can be achieved, which appears unlikely.
If the trend continues down from here, my next target is the lower tramline into territory well below the 1000 level.
These articles are provided for information purposes only. Occasionally, an opinion about whether to buy or sell a specific investment may be provided by third parties. The content is not intended to be a personal recommendation to buy or sell any financial instrument or product, or to adopt any investment strategy as it is not provided based on an assessment of your investing knowledge and experience, your financial situation or your investment objectives. The value of your investments, and the income derived from them, may go down as well as up. You may not get back all the money that you invest. The investments referred to in this article may not be suitable for all investors, and if in doubt, an investor should seek advice from a qualified investment adviser.
Full performance can be found on the company or index summary page on the interactive investor website. Simply click on the company's or index name highlighted in the article.
Disclosure
We use a combination of fundamental and technical analysis in forming our view as to the valuation and prospects of an investment. Where relevant we have set out those particular matters we think are important in the above article, but further detail can be found here.
Please note that our article on this investment should not be considered to be a regular publication.
Details of all recommendations issued by ii during the previous 12-month period can be found here.
ii adheres to a strict code of conduct. Contributors may hold shares or have other interests in companies included in these portfolios, which could create a conflict of interests. Contributors intending to write about any financial instruments in which they have an interest are required to disclose such interest to ii and in the article itself. ii will at all times consider whether such interest impairs the objectivity of the recommendation.
In addition, individuals involved in the production of investment articles are subject to a personal account dealing restriction, which prevents them from placing a transaction in the specified instrument(s) for a period before and for five working days after such publication. This is to avoid personal interests conflicting with the interests of the recipients of those investment articles.