Chart of the week: Dramatic move possible for easyJet shares
1st June 2015 13:28
by John Burford from interactive investor
Share on
By John C Burford, author of Tramline Trading, and editor of MoneyWeek Trader
In these weekly articles, I will highlight a share that I believe has an interesting chart pattern. I am primarily a technical trader and use the methods I have developed that I call Tramline Trading. You can read more about my methods in my book Tramline Trading, which you can inspect here.
Most traders and investors make classic errors by chasing a stock near a top and then hang on to it too long during the decline. You will vastly improve your performance by timing your entries and exits more expertly - and that is what I hope to help you with.
My goal in these articles is to cover a share that has an interesting chart. I I developed my tramline system over several years to give me a set of rules which can provide me with trade entries at low risk. The low risk requirement was crucially important because no matter how firmly I believe in my trade, I could be wrong! And I wanted my wrong trades to hand me the smallest possible loss to my account. I figured the winners would take care of themselves.
My hope is that you glean useful ideas and employ at least some technical analysis to bolster your returns. In trading as well as investing, timing is a key factor in your eventual returns.
easyJet flies into turbulence
Shares of budget airlines have been soaring in recent months, partly spurred on by the decline in fuel prices, an increase in air fares and steady demand. With this bullish underlying picture, any fly in this ointment is likely to hit airlines hard.
That is why the strike by French (who else?) air traffic controllers put a big question mark over future earnings - which are challenged anyway by more intense competition in the industry.
Competition is so fierce in Europe that Air Berlin, Germany's second biggest airline, is in trouble as it has made operating losses in four of the past five years.
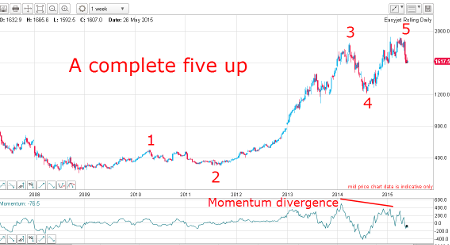
Here is the long-term weekly chart of showing the market has been in a strong bull trend:
(click to enlarge)
But according to my Elliott wave count, we have a complete five waves up. That means the main trend is now down, most likely in an A-B-C three-wave affair.
In fact, this count is almost textbook perfect. It took three years to make it to the wave 2 low and two-and-a-half years from there to the wave 3 high in early 2014. My wave 3 is long and strong, as is required and I can even count a mini-five up within this third wave.
This third wave saw a 350% appreciation of the shares - a phenomenal performance for a FTSE 100 company.
From the wave 3 high, the market dipped in wave 4 and then raced ahead into new highs in wave 5 - the final wave. And this wave 5 high occurred on a large negative momentum divergence - a sure sign that buying pressure was weaker in wave 5 than it was in the upper reaches of wave 3. This is one of the characteristics of fifth waves - they are invariably weaker than the third wave.
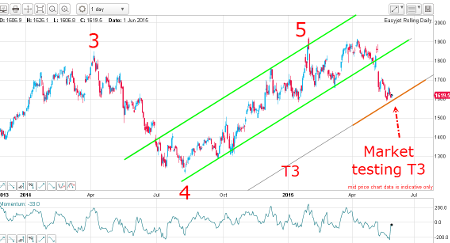
Let's take a look at a close-up chart:
(click to enlarge)
I have a lovely tramline pair working (green lines) within which wave 5 has been trading in the channel described by the lines.
And on 13 May, the market was hit hard by the company's profit warning for the summer. They evidently believe there will be more disruptions to travel during this summer's busy period. The shares are presently trading over 15% lower than in early April.
With that decline, the market has run down to T3, my third equidistant tramline and is currently testing the support there.
Outlook
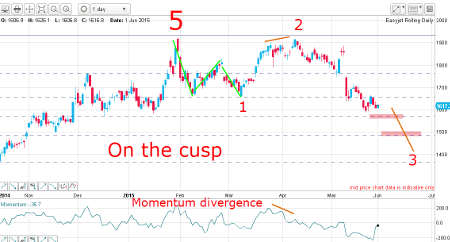
At the £16 level, the market is at a crossroads. Here is one alternative outcome:
(click to enlarge)
The market has moved off the wave 5 top in waves 1 and 2 and now wave 3 of a potential five down. The wave 2 high was made on a textbook momentum divergence and the move down off that high has been sharp, as is typical of third waves.
The market is close to the Fibonacci 50% level and under that, the 62% support. Breaking those would put the odds firmly on the bear side of the ledger.
But if the market can catch a bid, there are some gaps overhead that can be filled. But the shares are not out of the woods there, and the downside still appears more attractive.
Longer-term, the wave 4 low (top chart) at the £12 area is a good target which is roughly a Fibonacci 50% correction to the main bull run.
These articles are provided for information purposes only. Occasionally, an opinion about whether to buy or sell a specific investment may be provided by third parties. The content is not intended to be a personal recommendation to buy or sell any financial instrument or product, or to adopt any investment strategy as it is not provided based on an assessment of your investing knowledge and experience, your financial situation or your investment objectives. The value of your investments, and the income derived from them, may go down as well as up. You may not get back all the money that you invest. The investments referred to in this article may not be suitable for all investors, and if in doubt, an investor should seek advice from a qualified investment adviser.
Full performance can be found on the company or index summary page on the interactive investor website. Simply click on the company's or index name highlighted in the article.
Disclosure
We use a combination of fundamental and technical analysis in forming our view as to the valuation and prospects of an investment. Where relevant we have set out those particular matters we think are important in the above article, but further detail can be found here.
Please note that our article on this investment should not be considered to be a regular publication.
Details of all recommendations issued by ii during the previous 12-month period can be found here.
ii adheres to a strict code of conduct. Contributors may hold shares or have other interests in companies included in these portfolios, which could create a conflict of interests. Contributors intending to write about any financial instruments in which they have an interest are required to disclose such interest to ii and in the article itself. ii will at all times consider whether such interest impairs the objectivity of the recommendation.
In addition, individuals involved in the production of investment articles are subject to a personal account dealing restriction, which prevents them from placing a transaction in the specified instrument(s) for a period before and for five working days after such publication. This is to avoid personal interests conflicting with the interests of the recipients of those investment articles.