Chart of the week: New target for Glencore, and others
19th October 2015 12:18
by John Burford from interactive investor
Share on
I have updates today on three shares I have been covering because there have been some recent dramatic developments that have illustrated how important are the warnings given by reading the charts – and how useful are my tramline techniques for setting price targets.
Glencore rebounds on cue
One of the most timely warnings was given in my September 7 COTW. was in freefall and under a barrage of headlines proclaiming the end was nigh for the company. The reason given in the mainstream media was that the company was labouring under a mountain of debt as commodity prices were in a state of collapse. Some pundits even forecast its imminent bankruptcy.
When I see garish headlines everywhere, I bring out of my drawer what I call the HI – the Headline Indicator. Very simply, when the headlines proclaim either a disaster (in a bear market) or untold riches to be scooped up (in a bull market), that is when I start to look for the opposite trade. But timing has to be pinpoint perfect, especially if spread betting (because this is a highly leveraged product).
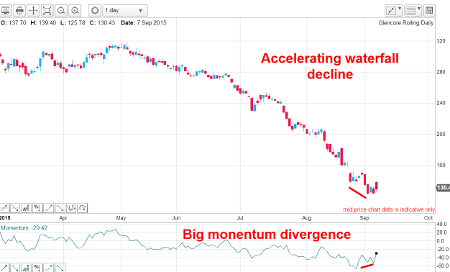
This was the chart then:
(Click to enlarge)
I pointed out that the decline was very close to a Fibonacci 78% retrace of the IPO price – a natural support level. This is what I wrote: "Note the waterfall cascade off the 300p high back in April. There has only been one single up week since then – it is a sea of red. Not only that, but short interest has been rising since July near today's lows. That short interest could be the fuel for a short squeeze and drive the market much higher. The dominoes are on place for a surprise for the shorts."
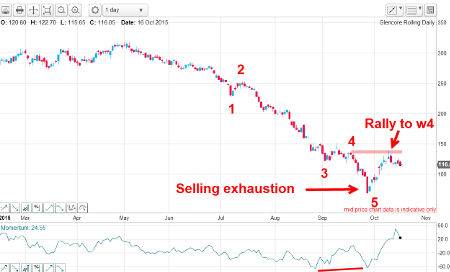
And this is the current daily chart:
(Click to enlarge)
The low was made on 28 September at the 67p level – and the momentum divergence was maintained to that low. Now I can place Elliott wave labels on the entire decline – and the selling exhaustion day was the wave 5 low.
Since then, the market has doubled and roared back to the 140p high – and note that this was the level of the wave 4 high. This was the short squeeze I had forecast. In fact, fourth wave extremes are very often targets for counter-trend rallies – and this one is a classic example.
With that knowledge, long trades taken within the fifth wave down could be exited at or near the wave-4 high at 140p for a tidy profit.
Currently, the market is backing off with momentum very overbought and there is a gap just below at the 100p level, which is likely to be filled. That could be wave B of an A-B-C, which implies a continuation of the counter-trend rally in wave C which could extend to the 160p area.
Burberry is out of fashion
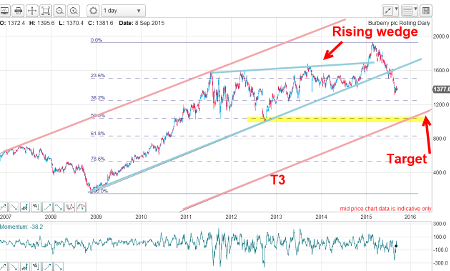
I covered on September 14 and was pretty bearish on it. This was the chart then:
(Click to enlarge)
This is what I wrote: "It is possible the market will sell off hard in the next few weeks, in which case, it would meet not only T3, but also the Fibonacci 50% support level (highlighted). This area around the 1000 level has also provided major support back in 2012. This means the market considers the 1000 area very important.
"But a more likely outcome is for support to emerge before that event, but to offer latecomers an opportunity to cash out and/or position short."
In fact, following my note, the market performed according to the script and rallied to the 1,500p area where an opportunity to cash out was presented – and to position short.
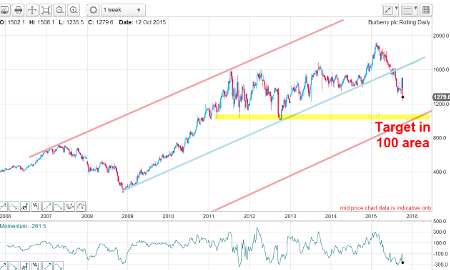
This is the current chart showing the sharp decline last week on the back of disappointing China and South Korea sales:
(Click to enlarge)
My target remains in the 1,100p area. My outlook for luxury brands is not bullish – a stance I have had for many months. Incidentally, prior to a general bear market, it is often the luxury industry that is among the first to feel the chill winds. I await the same fate for the art market.
Rio Tinto mines a short squeeze
I had a brief mention of last week which had rallied alongside the general commodity complex and this was the chart then:
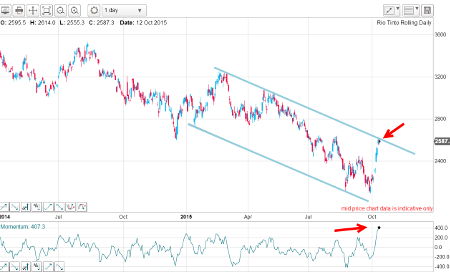
(Click to enlarge)
I had a good tramline pair in blue working and the market had just hit the upper line of resistance and this is what I said then: "With many commodity shares in a similar temporarily overbought situation, odds favour at least a pause for breath around current values before they make another assault on the tramline resistance.
"I expect dips over the next few days which should offer late-comers an opportunity to position long. The current rally in commodities have much more to run."
And this is the updated chart:
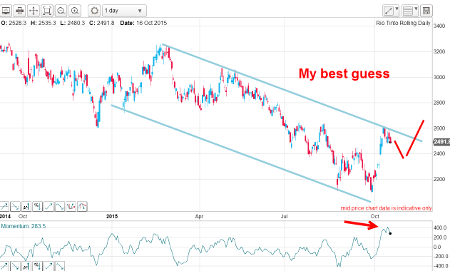
(Click to enlarge)
As forecast, the market has backed off my tramline – and offered an opportunity to take short-term profits. Now, the market is consolidating gains on overbought momentum and I expect support to emerge in the 2,200p–2,300p region before making another assault on the upper tramline.
Breaking above that will herald a likely move towards the 2,700p–2,800p area. And then my main target will heave into view at the 2,900p–3,000p area.
This article is for information and discussion purposes only and does not form a recommendation to invest or otherwise. The value of an investment may fall. The investments referred to in this article may not be suitable for all investors, and if in doubt, an investor should seek advice from a qualified investment adviser.
These articles are provided for information purposes only. Occasionally, an opinion about whether to buy or sell a specific investment may be provided by third parties. The content is not intended to be a personal recommendation to buy or sell any financial instrument or product, or to adopt any investment strategy as it is not provided based on an assessment of your investing knowledge and experience, your financial situation or your investment objectives. The value of your investments, and the income derived from them, may go down as well as up. You may not get back all the money that you invest. The investments referred to in this article may not be suitable for all investors, and if in doubt, an investor should seek advice from a qualified investment adviser.
Full performance can be found on the company or index summary page on the interactive investor website. Simply click on the company's or index name highlighted in the article.
Disclosure
We use a combination of fundamental and technical analysis in forming our view as to the valuation and prospects of an investment. Where relevant we have set out those particular matters we think are important in the above article, but further detail can be found here.
Please note that our article on this investment should not be considered to be a regular publication.
Details of all recommendations issued by ii during the previous 12-month period can be found here.
ii adheres to a strict code of conduct. Contributors may hold shares or have other interests in companies included in these portfolios, which could create a conflict of interests. Contributors intending to write about any financial instruments in which they have an interest are required to disclose such interest to ii and in the article itself. ii will at all times consider whether such interest impairs the objectivity of the recommendation.
In addition, individuals involved in the production of investment articles are subject to a personal account dealing restriction, which prevents them from placing a transaction in the specified instrument(s) for a period before and for five working days after such publication. This is to avoid personal interests conflicting with the interests of the recipients of those investment articles.