Chart of the week: This bank share could crash
2nd November 2015 10:33
by John Burford from interactive investor
Share on
Meggitt bombs big time
, a major UK aerospace engineering company, suffered a major sell-off late last week. I want to cover it, not because I believe it represents a trading/investing opportunity, but as an example of how very badly investment advice from the big trading houses can go wrong and as a warning from me to avoid it.
Here is the daily chart:
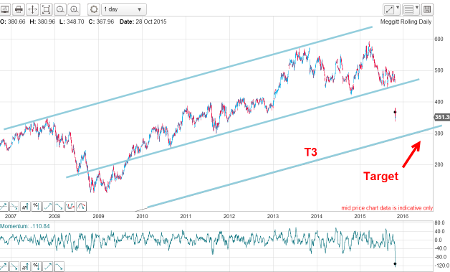
(click to enlarge)
On Friday, following the shock profit warning, the market closed down almost 30% on the day - and crashed straight through my multi-year tramline. If you were long this share and had a stop loss just below my tramline, your fill would have been horrendously painful. My immediate target now is T3 in the 300p region, but a relief rally is likely near-term.
And as a stunning example on why a private trader/investor should take Buy notes from investment houses with great lumps of salt (especially after a very tired six-year bull run), here is some of the advice issued just before the plunge:
Meggitt's Buy Rating Reiterated by Investec - 28 October
Meggitt given Equal Weight Rating by Morgan Stanley - 28 October
RBC Capital reaffirms Buy Rating for Meggitt - 23 October
Meggitt's Buy Rating reaffirmed at Haitong Securities - 21 October
There are plenty more, but you get the drift. To issue a Buy Rating a day or so before a 30% plunge must rank as one of the worst calls in recent memory.
But will the boy wonder PhD analysts lose their jobs over it? Hardly.
The degree of independent thinking among these houses must be close to an all-time low in this era of total stockmarket complacency. It is Groupthink to the max and is best avoided, unless you enjoy irony of course - and also enjoy losing money.
Barclays continues its bear trend
I last covered on August 24 and, so far, my bearish forecast has come to pass, with the market hitting my first major target of 230p on Friday.
Recall what I wrote in August: "Two weeks ago, the market made a high at the 290 area - and hit the Fibonacci 62% retrace of the previous wave from the May 2014 high to the July 2014 low. Remember, this Fibonacci level is a common turning point for trends - and so it proved here.
"On Friday, my lower tramline was broken and this morning, we have a gap lower opening as panic selling grips the general market. The market is off by around the same 15%.
"My first target is the lower wedge line in the 230 area."Bullseye!
This was the chart I was working in August:
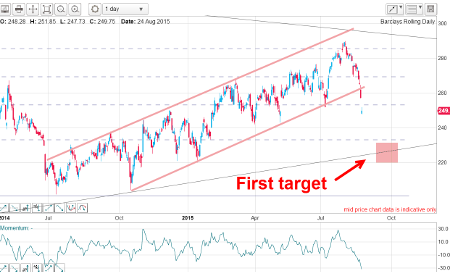
(click to enlarge)
The market had broken below my lower short-term (tan) tramline in a gap down that day and was heading for my long-term lower wedge line drawn off the 2009 low.
This is the updated weekly multi-year chart:

(click to enlarge)
The six years-plus wedge pattern contains textbook five waves as I showed in August, and that means the wedge is now full and the market is poised for a sharp break down in wave 5.
But having hit a major target, some profit-taking on shorts is in order.
Outlook
Because the finance sector has been one of the leaders of the 2009 - 2015 bull market that was "inspired" by the actions of central banks, it will be one of the leaders on the way down.
Note that for all of the virtually unlimited "stimulus" showered on the Too-Big-To-Fail banks by the Fed, BOE and BOJ especially (and now ECB), Barclays' share price did not even manage a 50% retrace of the decline off the 780p highs of 2007. In fact, the share price is closer to the 50p low of 2009 than the all-time high. What an indictment of the misguided central bank policies.
It is clear that hardly any of the central bank "stimulus" managed to escape onto Main Street, but was garnered by Wall Street (and London) for the massive financial engineering schemes dreamed up by the banks, hedge funds and other money managers. Debt levels are much higher now than they were just prior to the Credit Crunch collapse.
But with the increasing burden of bank regulation and the prospect of interest rates having bottomed out and now turning up, and of course with consumers and companies having maxed out on their credit cards, my outlook for the banking sector remains bleak.
I believe the 2009 low at the 50p level will be tested in the next twelve months or so.
Royal Dutch Shell pauses, as forecast
I have been covering extensively this year and make no apologies - my forecasts have been pretty accurate (so far). In my latest note on October 12, the rally that I had forecast from under the 1,600p level had paused at my upper tramline:
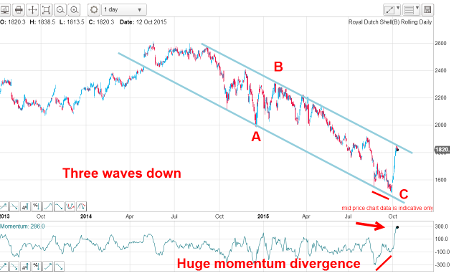
(click to enlarge)
and I noted that is where short-term profits just above the 1,800p level could be banked. Crude oil (US) had reached the $50 level and my reading of this chart suggested a pullback was on the cards.
In fact, the quoted 1,820 print was close to the high with the market closing Friday at the sub-1,700 level.
But is the dip about to end and the market poised to resume its rally?
One of the patterns I like to see on a dip is a three-wave pullback that I can label as an A-B-C. Three-wave patterns are always counter-the one larger trend, which in this case is up - and this gives a clue to the next move. Here is the hourly chart as of Friday's close:
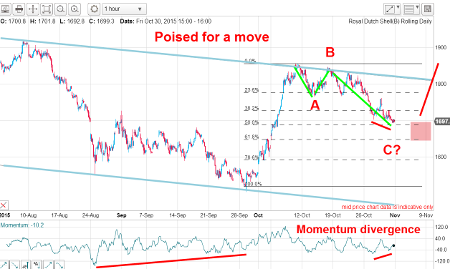
(click to enlarge)
I have my A-B-C and the market is testing the Fibonacci 50% support level. I also have a nice positive momentum divergence (matching that larger one earlier in October). Odds are stacking up the rally could resume from near current levels.
Allowing for a slightly larger pullback to the Fibonacci 62% support level at the 1,650p level, I have drawn in the zone from where the rally should resume.
Despite all the gloomy news of last quarter's major losses, the shutdown of projects and the talk of reducing the dividend, my outlook is for sharply higher prices over the next few weeks/months.
This article is for information and discussion purposes only and does not form a recommendation to invest or otherwise. The value of an investment may fall. The investments referred to in this article may not be suitable for all investors, and if in doubt, an investor should seek advice from a qualified investment adviser.
These articles are provided for information purposes only. Occasionally, an opinion about whether to buy or sell a specific investment may be provided by third parties. The content is not intended to be a personal recommendation to buy or sell any financial instrument or product, or to adopt any investment strategy as it is not provided based on an assessment of your investing knowledge and experience, your financial situation or your investment objectives. The value of your investments, and the income derived from them, may go down as well as up. You may not get back all the money that you invest. The investments referred to in this article may not be suitable for all investors, and if in doubt, an investor should seek advice from a qualified investment adviser.
Full performance can be found on the company or index summary page on the interactive investor website. Simply click on the company's or index name highlighted in the article.
Disclosure
We use a combination of fundamental and technical analysis in forming our view as to the valuation and prospects of an investment. Where relevant we have set out those particular matters we think are important in the above article, but further detail can be found here.
Please note that our article on this investment should not be considered to be a regular publication.
Details of all recommendations issued by ii during the previous 12-month period can be found here.
ii adheres to a strict code of conduct. Contributors may hold shares or have other interests in companies included in these portfolios, which could create a conflict of interests. Contributors intending to write about any financial instruments in which they have an interest are required to disclose such interest to ii and in the article itself. ii will at all times consider whether such interest impairs the objectivity of the recommendation.
In addition, individuals involved in the production of investment articles are subject to a personal account dealing restriction, which prevents them from placing a transaction in the specified instrument(s) for a period before and for five working days after such publication. This is to avoid personal interests conflicting with the interests of the recipients of those investment articles.