Chart of the week: Why BT and this miner will rally
9th November 2015 09:44
by John Burford from interactive investor
Share on
BT - phone home!
At least, that is what I thought he said in the 1982 movie E.T. the Extra-Terrestrial. And closer to the present day, the chart is no alien to the bulls. It is in a firm uptrend as the company has recently re-entered the mobile phone sector with its takeover of the mobile company EE. It has decided to be very aggressive in offering very competitive 4G tariffs to grow market share. And this may be one of the few mega mergers that actually adds shareholder value!
And with the UK mobile phone market revenues showing little sign of slowing, the market is reacting bullishly and its chart is looking very constructive. Here is the daily chart:
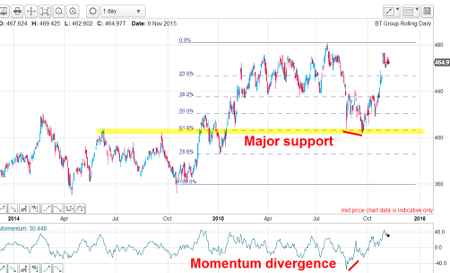
(click to enlarge)
Note that the dip in August/September was met at major support at the meeting of the Fibonacci 62% level and the chart support provided by the two previous highs in June and September last year. Not only that, but there was a huge positive momentum divergence at last September's low, indicating a sharp recovery ahead.
And that sharp recovery has occurred, as the market has tested the old 480p high in recent days.
Let's step back and review this action. Back in September, as the market was in a corrective downtrend, was it obvious that the EE deal was to be waved through by Ofcom? This was a terrific opportunity to trade against the market!
Outlook
The market is clearly overbought near-term and a dip is likely from near current levels. But I expect new highs to be achieved in due course. Here is the weekly:
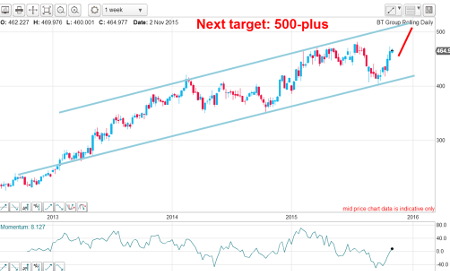
(click to enlarge)
The market is travelling in the trading channel between my tramlines and I see no reason why it should not meet the upper tramline again in the 500-plus region. A break of the lower tramline, which I do not expect, would change my outlook.
Update on Rio Tinto
There have been some interesting developments since I last covered . In my email of October 19, I wrote: "Now the market is consolidating gains on overbought momentum and I expect support to emerge in the 2,200 - 2,300p region before making another assault on the upper tramline."
This is the hourly chart updated to Friday:
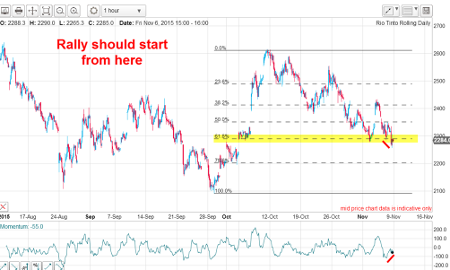
(click to enlarge)
And on Friday, the market dipped to just under the £23 print, which is right on the Fibonacci 62% support level. And the decline off the £26 high appears corrective because the waves are overlapping. In a strongly directional wave, the correctional waves rarely overlap. The rally off the early October low to the £26 high contains few overlapping waves. That move is a motive wave and uni-directional and points to the one larger trend being up.
The corrective decline off that high points to a resumption of the uptrend.
Update on Aberdeen Asset Management
This is another issue that has hit my original target according to my forecast. Back on August 17, my analysis suggested that the 300p level was my major objective and this was the chart I showed:

(click to enlarge)
I noted the very large rising wedge pattern that started at the 320 level back in 2012 and this is what I wrote:"Also in the above chart, the complex wave 4 traced out a rising wedge - one of my favourite reversal patterns because it allows for a specific price forecast - and that is that when broken, the market's main target is the start of the wedge - in this case, around the 300 area."
And since then, there have been major news developments. On October 28, this was a mainstream media headline: "'s shares soar on takeover hopes". So did that bombshell send the shares back up? Of course not, they continued their one-way plunge towards my target. The die was cast for the shares to reach the 300 level, as ordained by my wedge analysis. Here is the latest chart:
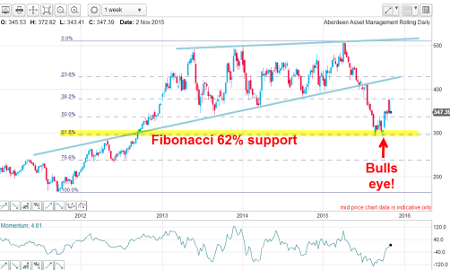
(click to enlarge)
And by sheer coincidence (!), the 300 level was also the level of the Fibonacci 62% retrace of the latest large wave up. That was the area to take major short-term profits with the market being short-term oversold (low momentum reading).
Outlook
Now the shares have bounced off the 300 level (on merger talk), is the bull run about to resume? Here is the short-term daily chart:
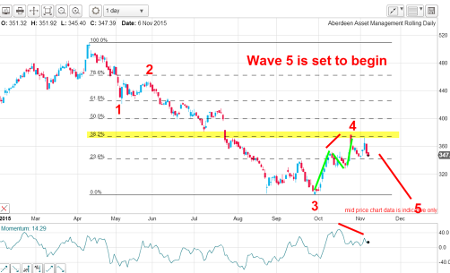
(click to enlarge)
The bounce off the 300 level is in an A-B-C three up (so far) and has hit the Fibonacci 38% resistance zone. There is a large gap from mid-July and the rally has hit the edge of that gap - often a level where there lurks high resistance.
There is a large momentum divergence at the high and this should be the wave 4 top. Wave 5 down should have started and the outlook is for more declines ahead to below the 300 low.
This article is for information and discussion purposes only and does not form a recommendation to invest or otherwise. The value of an investment may fall. The investments referred to in this article may not be suitable for all investors, and if in doubt, an investor should seek advice from a qualified investment adviser.
These articles are provided for information purposes only. Occasionally, an opinion about whether to buy or sell a specific investment may be provided by third parties. The content is not intended to be a personal recommendation to buy or sell any financial instrument or product, or to adopt any investment strategy as it is not provided based on an assessment of your investing knowledge and experience, your financial situation or your investment objectives. The value of your investments, and the income derived from them, may go down as well as up. You may not get back all the money that you invest. The investments referred to in this article may not be suitable for all investors, and if in doubt, an investor should seek advice from a qualified investment adviser.
Full performance can be found on the company or index summary page on the interactive investor website. Simply click on the company's or index name highlighted in the article.
Disclosure
We use a combination of fundamental and technical analysis in forming our view as to the valuation and prospects of an investment. Where relevant we have set out those particular matters we think are important in the above article, but further detail can be found here.
Please note that our article on this investment should not be considered to be a regular publication.
Details of all recommendations issued by ii during the previous 12-month period can be found here.
ii adheres to a strict code of conduct. Contributors may hold shares or have other interests in companies included in these portfolios, which could create a conflict of interests. Contributors intending to write about any financial instruments in which they have an interest are required to disclose such interest to ii and in the article itself. ii will at all times consider whether such interest impairs the objectivity of the recommendation.
In addition, individuals involved in the production of investment articles are subject to a personal account dealing restriction, which prevents them from placing a transaction in the specified instrument(s) for a period before and for five working days after such publication. This is to avoid personal interests conflicting with the interests of the recipients of those investment articles.