Chart of the week: FTSE 100 heading for 3,500?
16th November 2015 11:26
by John Burford from interactive investor
Share on
In the normal course of my analysis of share charts of constituents of the index, I focus mainly on the stand-alone technical picture of each market, independent of current general business conditions.
Most of the time, especially during the bull market of 2009-2015, many shares were also in bull markets, although I have found several stand-out examples of bearish charts (see my coverage, in particular).
But no company exists in a vacuum. If business conditions are good, most companies will thrive and sentiment is bullish. But when sentiment turns down - as I believe is occurring now - many shares will change trend to down.
As an investor - which in reality is really a long-term trader - you can maximise your returns by selling shares near the top and sitting on the cash. I have never understood why someone would hold a share through all of the ups and downs that inevitably occur over a timespan of many years.
If it is the dividends you like, why not sell and then buy back at much lower prices? Of course, the reason is sheer inertia - and lack of confidence. And that is where technical analysis can help.
Yes, I believe the general market is now turning down, and today I want to show you my evidence based on the FTSE 100 index itself.
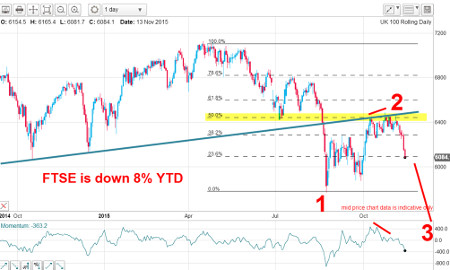
This is the chart I pulled only two weeks ago showing the entire 2009-2015 bull run:

(click to enlarge)
There are several important technical aspects of this chart that stand out.
1) The entire rally has the shape of a three-wave A-B-C, rather than a five wave pattern. The A-B-C is always counter-trend, implying that when the C wave terminates, the major downtrend will resume. If this were really part of a five wave advance, the market would recover from the August swoon and go on to new highs in a fifth wave. This is still a possible outcome, but it is of much lower odds because...
2) The major six-year uptrend line (in blue) is a solid line of support that has been broken in August and is now a line of resistance. Note the several highly accurate touch points all the way along it, making it a highly reliable line. The August break is a watershed event that has turned the bull market into a new bear market.
3) From August, the market has recovered and kissed the underside of the blue line of resistance. If this is a genuine kiss, then the next move will be a scalded cat bounce down (a sharp retreat). This is a typical reaction when the market, having broken key support and gingerly moved back to the line, is hit for six. It is like the north poles of two magnets kissing - and repelling each other with force.
And in the past two weeks, this is the action on the daily chart:
(click to enlarge)
I am calling the August plunge low a new large wave 1 and the rally to the kiss wave 2, which has the traditional counter-trend A-B-C form. The scalded cat bounce down has now confirmed that the odds for the market to make a new high, let alone rise above the blue line, are slim. The blue line has been tested and found to be strong resistance.
This all fits into my "third wave down" scenario. Because third waves are usually long and strong, what does this imply? Simply that the market is headed for a major decline. Here are my ideas on the weekly chart:

(click to enlarge)
My first target is the Fibonacci 50% retrace of the entire six-year rally at the 5,300 region. But my major objective is the Fibonacci 62% support level at the 4,800 area. This is where previous lows were made on the way up (red arrows) and, because markets have long memories, this Fibonacci level contains extra-strong support potential.
I will be looking for a major wave 4 rally phase here, but, when completed, the market should descend in a fifth wave, which should test the 2009 lows at the 3,500 region.
To many, these may seem outrageous forecasts - and that may be a clue that complacency has set rock-hard. We know that the global economy is weakening and is in a major deflationary spiral. Debt levels everywhere are sky-high and interest rates have been kept super-low for years, but will soon start to rise.
Not only that, but there is trouble brewing in the credit markets, with US corporate junk bond defaults rising rapidly. Bear markets in stocks usually start in the credit markets. Here is a sobering chart:

(click to enlarge)
Because debt levels are so much greater now than just before the Credit Crunch, rising defaults will have a greater impact across the debt spectrum - including the good-as-gold US Treasuries (and UK Gilts).
It will be a deflationary depression played out in the stockmarket - and I am sure I will be showing more bearish charts in COTW than bullish in the coming months.
Flash Alert
Overnight, the markets are reacting to the implications of the Paris bombings with early losses being erased. Note that the low has been put in right on the Fibonacci 78% support level as shown on the hourly chart. This is at the round-number 6,000 level:
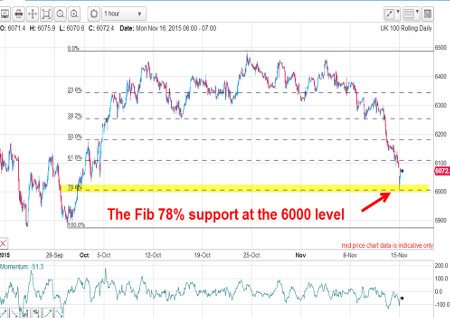
(click to enlarge)
This is one more demonstration of how very important the Fibonacci levels are when looking for potential support or resistance levels.
This article is for information and discussion purposes only and does not form a recommendation to invest or otherwise. The value of an investment may fall. The investments referred to in this article may not be suitable for all investors, and if in doubt, an investor should seek advice from a qualified investment adviser.
These articles are provided for information purposes only. Occasionally, an opinion about whether to buy or sell a specific investment may be provided by third parties. The content is not intended to be a personal recommendation to buy or sell any financial instrument or product, or to adopt any investment strategy as it is not provided based on an assessment of your investing knowledge and experience, your financial situation or your investment objectives. The value of your investments, and the income derived from them, may go down as well as up. You may not get back all the money that you invest. The investments referred to in this article may not be suitable for all investors, and if in doubt, an investor should seek advice from a qualified investment adviser.
Full performance can be found on the company or index summary page on the interactive investor website. Simply click on the company's or index name highlighted in the article.
Disclosure
We use a combination of fundamental and technical analysis in forming our view as to the valuation and prospects of an investment. Where relevant we have set out those particular matters we think are important in the above article, but further detail can be found here.
Please note that our article on this investment should not be considered to be a regular publication.
Details of all recommendations issued by ii during the previous 12-month period can be found here.
ii adheres to a strict code of conduct. Contributors may hold shares or have other interests in companies included in these portfolios, which could create a conflict of interests. Contributors intending to write about any financial instruments in which they have an interest are required to disclose such interest to ii and in the article itself. ii will at all times consider whether such interest impairs the objectivity of the recommendation.
In addition, individuals involved in the production of investment articles are subject to a personal account dealing restriction, which prevents them from placing a transaction in the specified instrument(s) for a period before and for five working days after such publication. This is to avoid personal interests conflicting with the interests of the recipients of those investment articles.